
Graph#
A graph shows a process's action sequence.
Access rights#
Configure role permissions on Roles. Open the required record, then the "Role" popup window's "Access" tab. Objects are arranged in rows, with checkboxes for permitted operations.
For "Show process graph", select these checkboxes in the "Dashboards" row:
- "Create" — permits creating a dashboard with the selected process's graph;
- "Read" — permits opening and viewing that dashboard.
Changing graph settings also requires "Update" in "Dashboards". Selecting a project and process requires "Read" in the "Projects" and "Processes" rows of the same tab.
Example: "Create", "Read", and "Update" are checked in "Dashboards". Only "Read" is checked in "Projects" and "Processes".
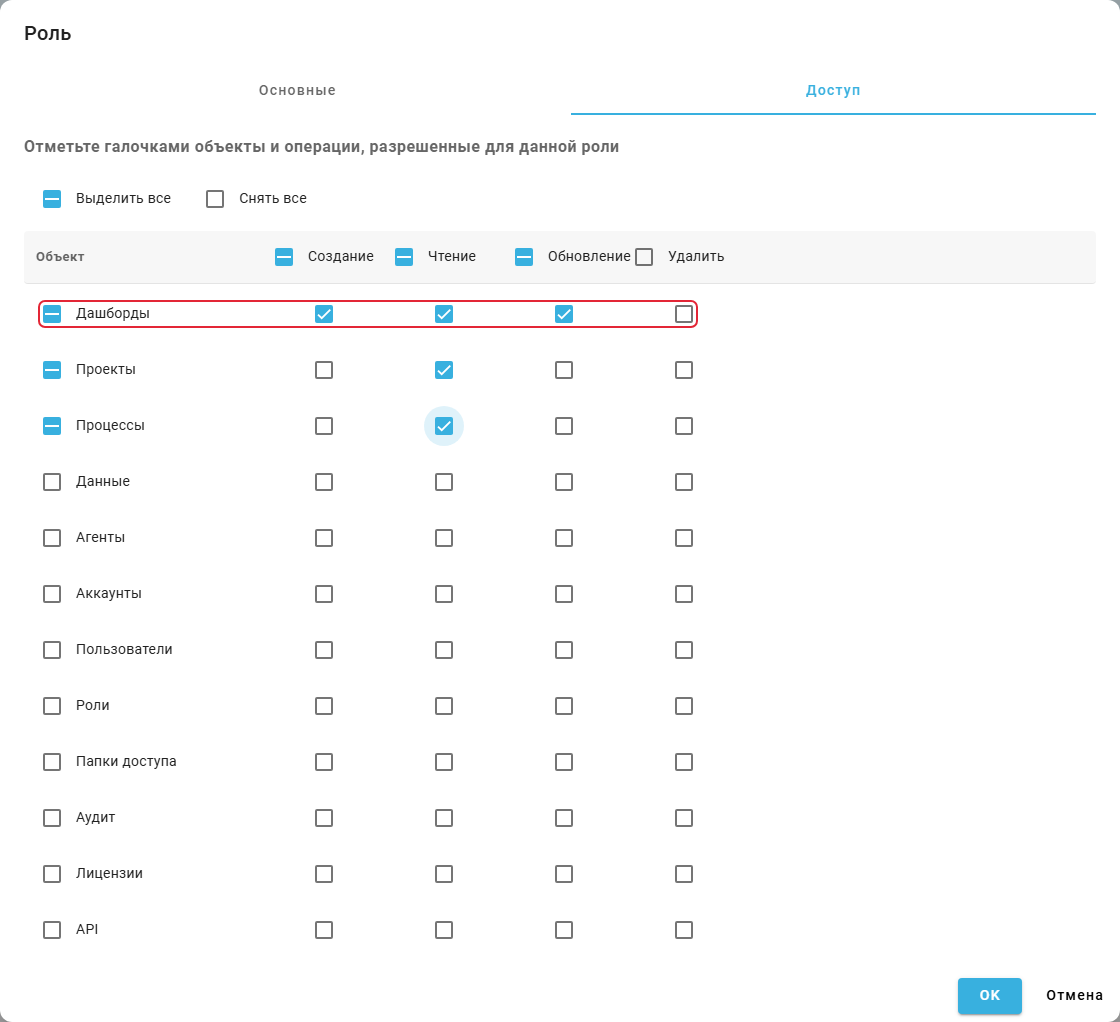
"Role" popup window, "Access" tab: permission checkboxes for "Dashboards".
Graph overview#
The graph appears in the "Process graph" dashboard widget. Its elements show the sequence of recorded user actions:
- nodes — actions or applications, depending on the selected naming source;
- arrows — transitions between nodes;
- numbers beside nodes and arrows — occurrence counts in a single-process graph. Process comparison metrics are described in "Widget settings";
- "start" and "finish" blocks — route boundaries.
Example: case #6126 is selected for Обработка заявок. Its route runs from receiving to closing a request through data checking and sending a response.
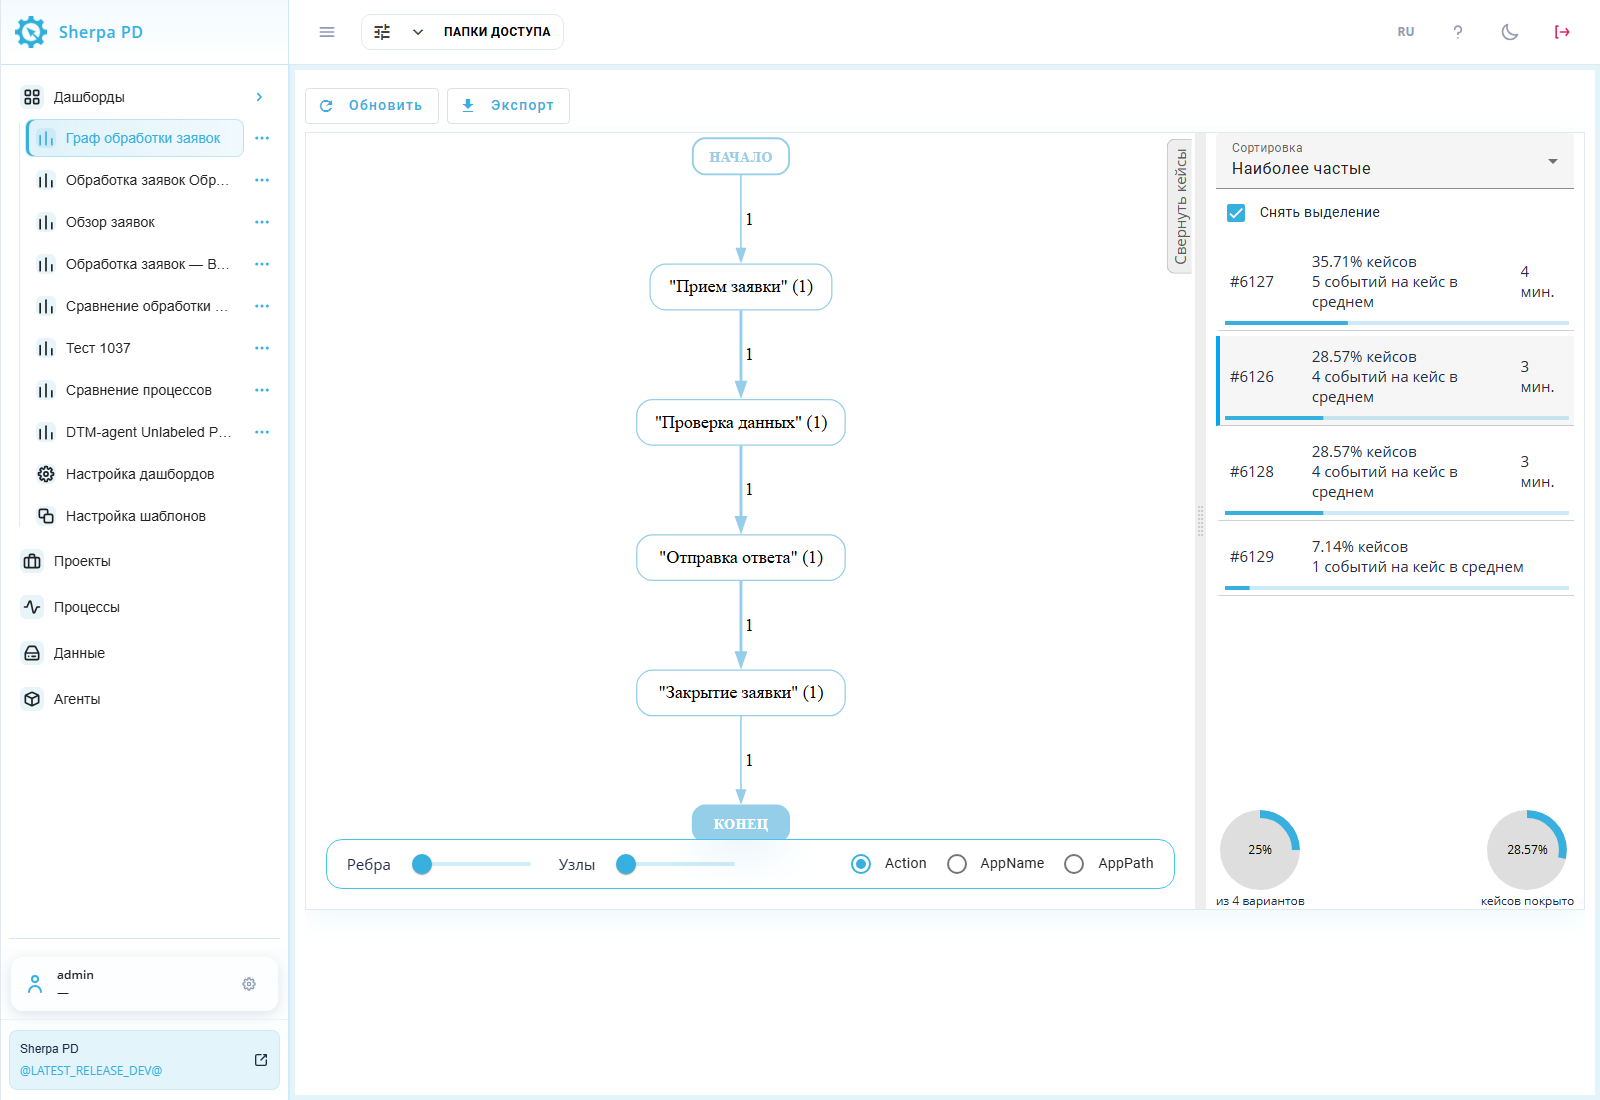
Dashboard, "Process graph" widget: nodes, transitions, and route boundaries.
1. Build a graph#
Open "Processes", select a project, and select one process. Click "Show process graph" above the table. A dashboard opens with the selected process's graph. Wait for the nodes and case list to load.
Example: process Обработка заявок is selected in the project of the same name. "Show process graph" opens its route from receiving to closing a request.
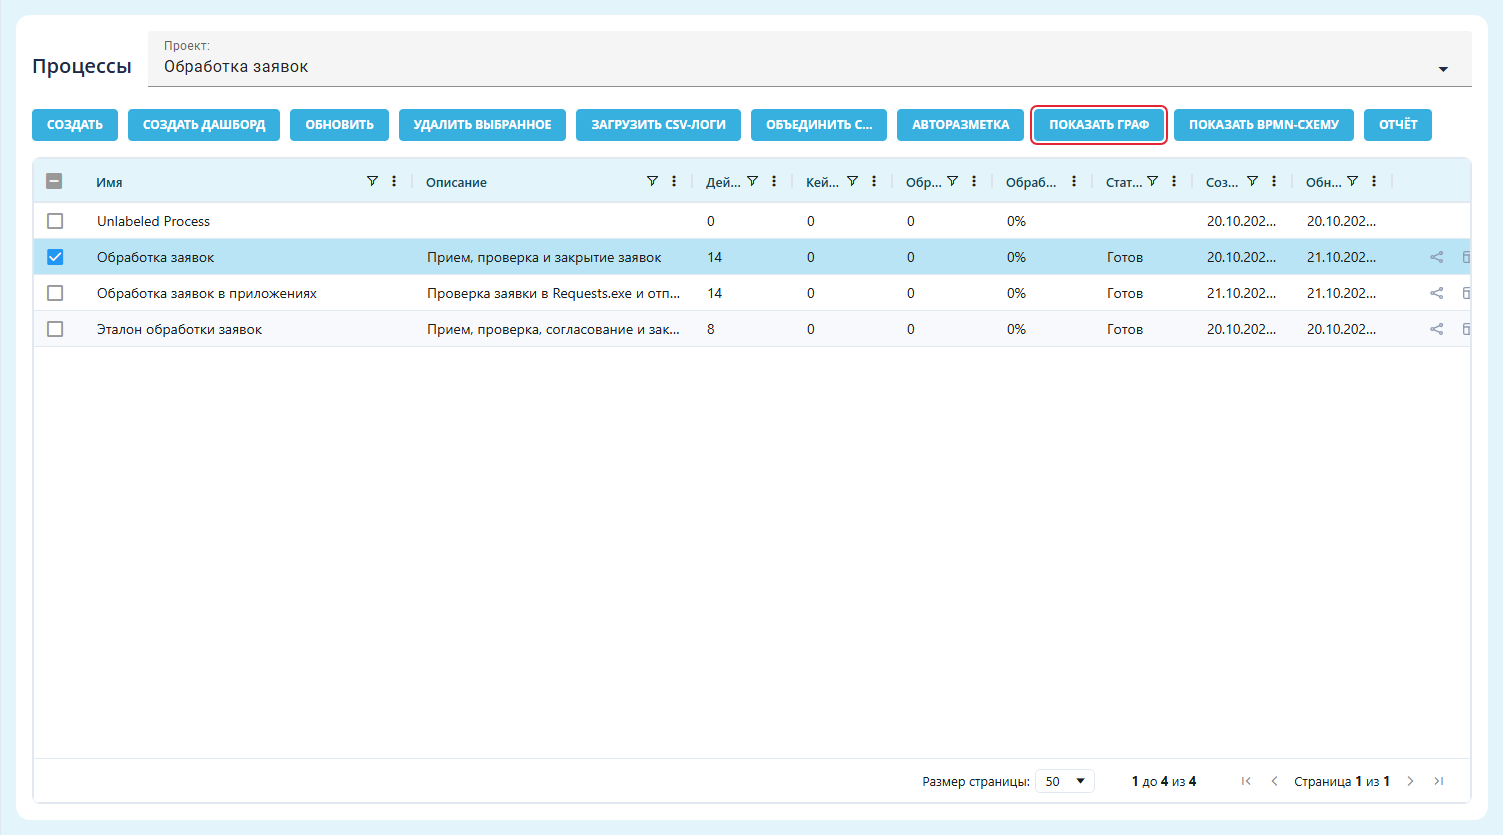
"Processes" screen: selecting a process for its graph.
To open a saved dashboard, expand "Dashboards" in the left menu and click the panel name. The training graph is on Граф обработки заявок.
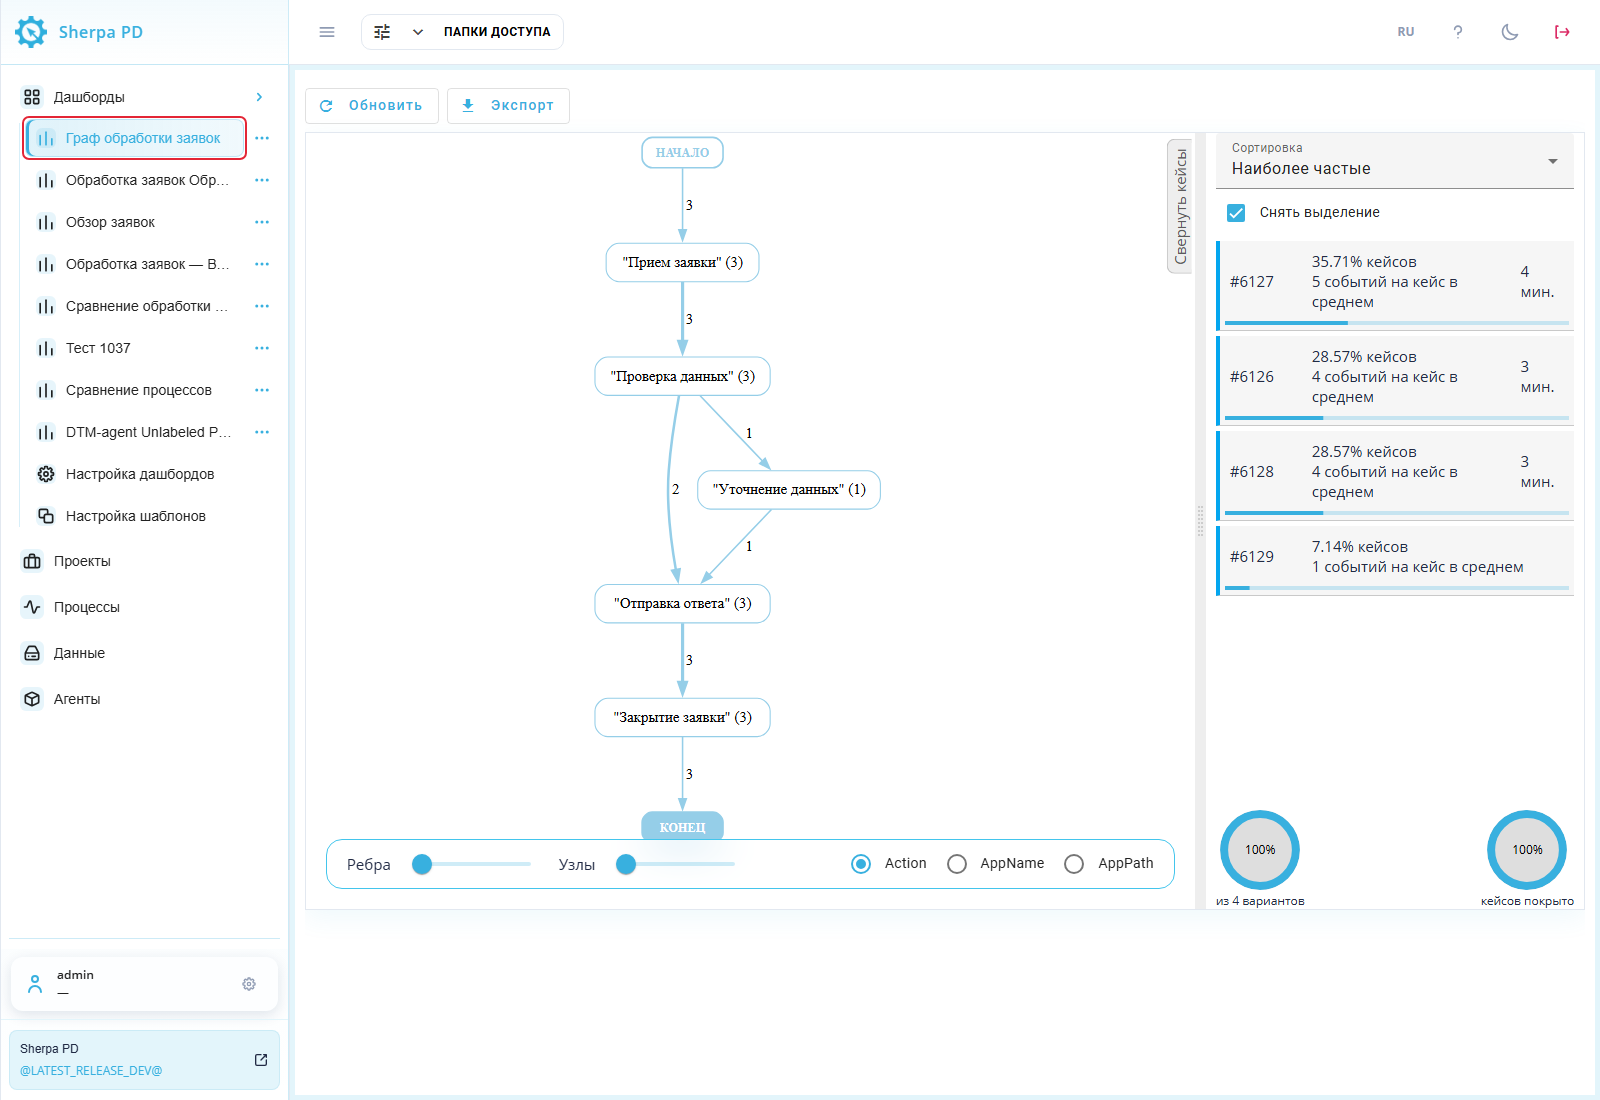
Left "Dashboards" menu: selected panel and "Process graph" widget.
To create a panel from a template, open "Processes", select a project and one process row, and click "Create Dashboard" above the table.
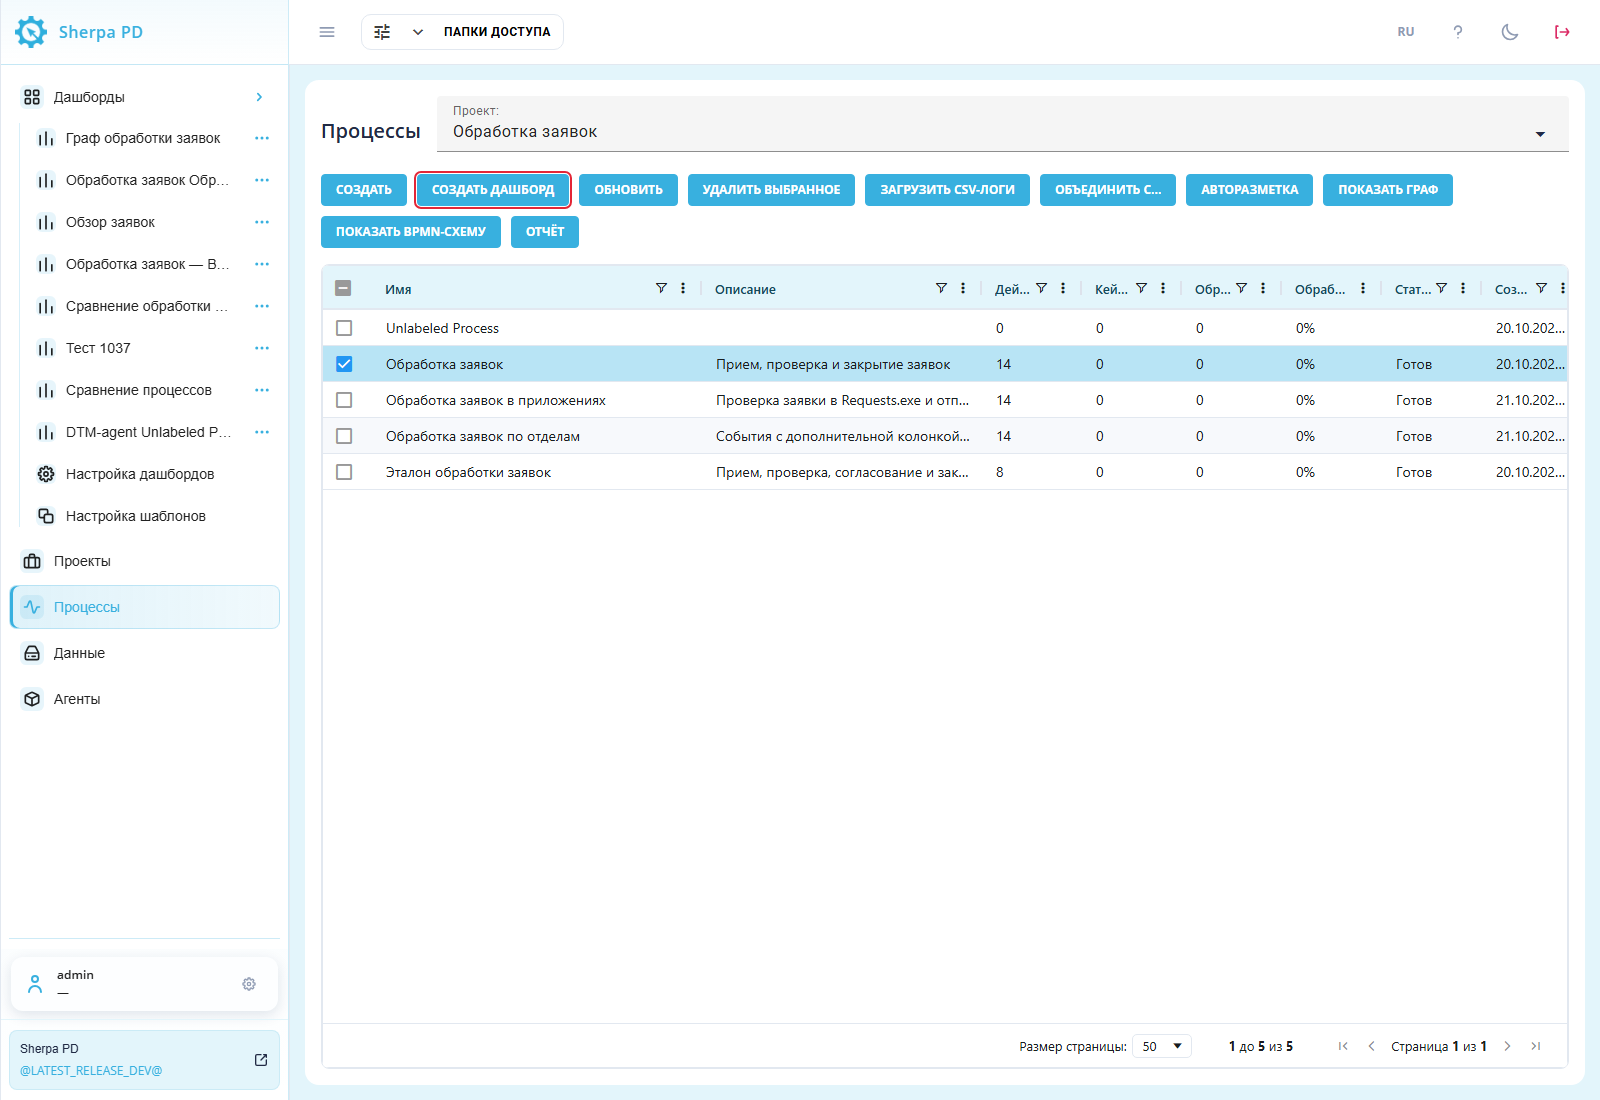
"Processes" screen: selected process and "Create Dashboard".
In the "Create Dashboard" popup window, choose "Base dashboard (example)" in "Select template" and click "OK".

"Create Dashboard" popup window: selecting a process template.
The panel appears under "Dashboards" in the left menu. Its "Process" filter supplies data to "Process graph". On the training panel Сравнение маршрутов, "Process" and "Reference process" are on the filter panel. See Dashboards for complete form examples.
2. Choose the source of node names#
Three radio buttons at the bottom of "Process graph" choose node names. They are available for Task Mining and Deep Task Mining projects:
- "Action" — recorded user actions;
- "AppName" — names of the applications used for those actions;
- "AppPath" — executable paths of those applications.
Selecting a different radio button rebuilds the graph.
Example: "Action" is selected in the three-control group to show recorded actions.

Dashboard, "Process graph" widget: "Action", "AppName", and "AppPath" radio buttons.
"Action" radio button#
"Action" displays recorded user actions as graph nodes. Names come from the selected process's event log.
Example: "Action" and case #6128 are selected. The graph shows recorded request-handling actions.

Dashboard, "Process graph" widget: "Action" radio button.
"AppName" radio button#
"AppName" shows the applications in which the user performed the recorded actions. Their names replace action names in graph nodes.
Example: process Обработка заявок в приложениях checks request data in Requests.exe and sends a response through Mail.exe. With "AppName" selected, the graph shows transitions between these applications.

Dashboard, "Process graph" widget: "AppName" radio button.
"AppPath" radio button#
"AppPath" shows executable paths of the applications used for recorded user actions. This helps distinguish programs with the same name launched from different folders.
Example: "AppPath" is selected for process Обработка заявок в приложениях. The nodes show C:\Apps\Requests\Requests.exe and C:\Apps\Mail\Mail.exe.
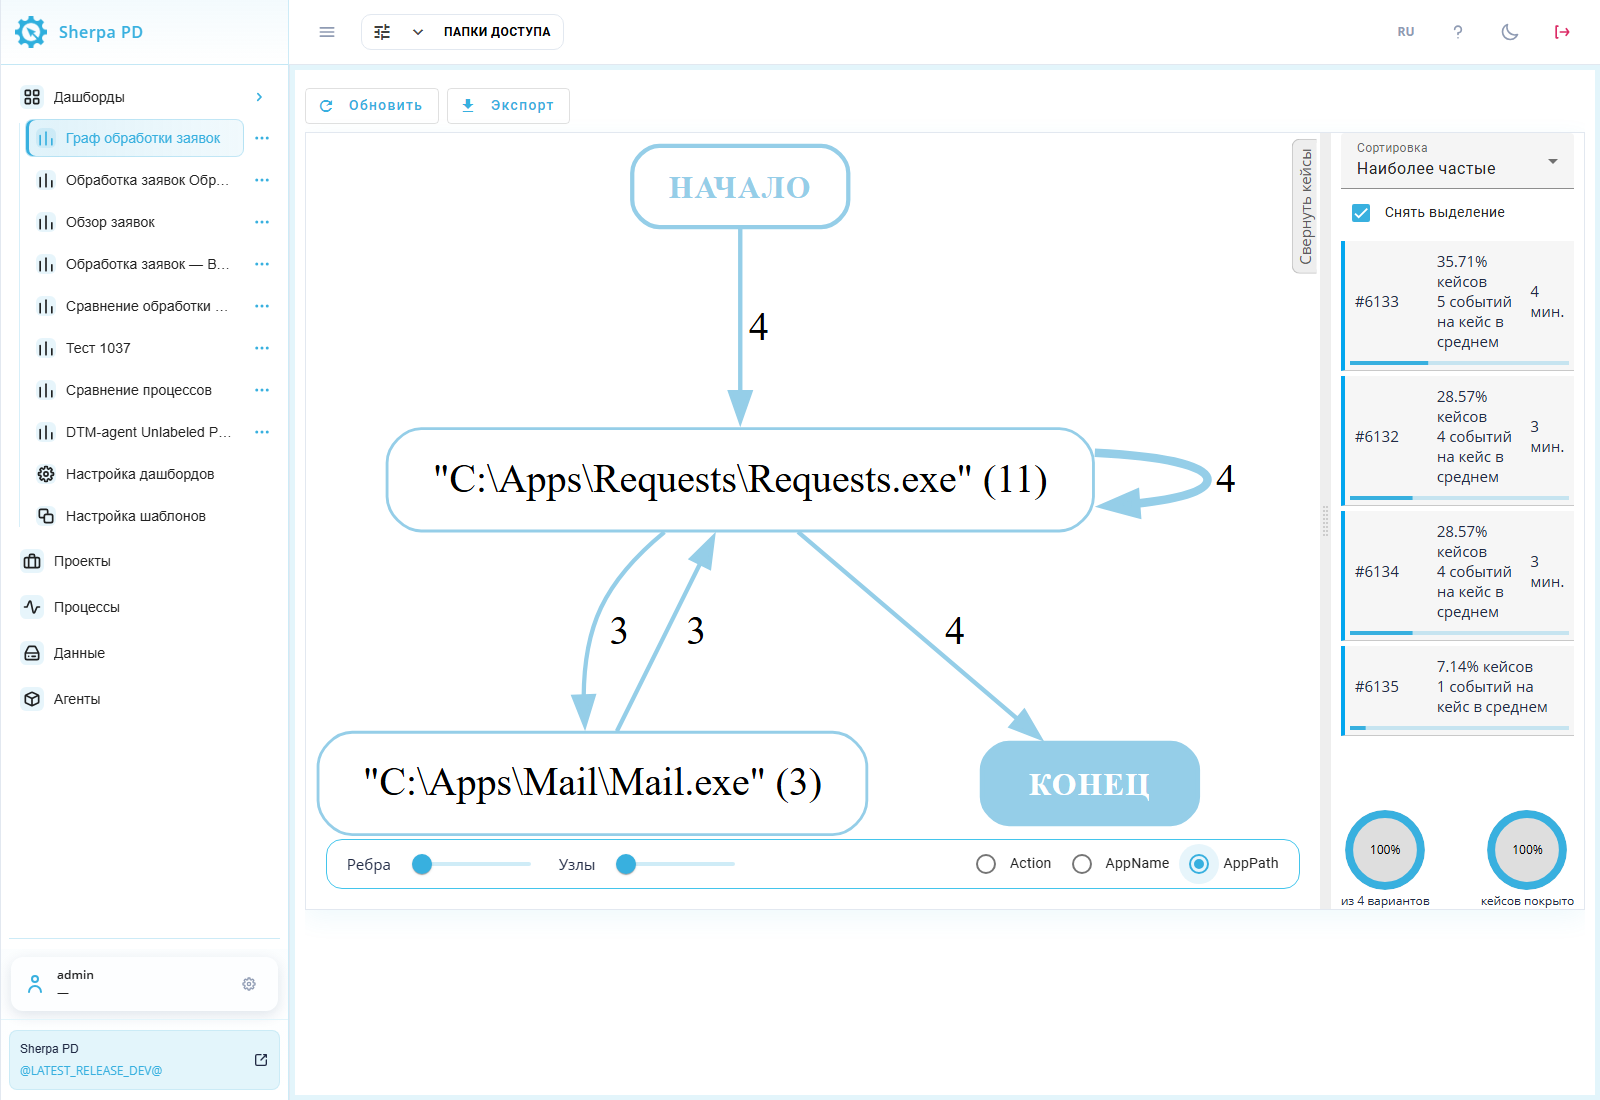
Dashboard, "Process graph" widget: "AppPath" radio button.
3. Employee filter#
To configure employee filtering, open "Customize Dashboards" in the left menu. In the Граф обработки заявок row, click "Form Designer"  .

"Customize Dashboards" screen: "Form Designer" in the graph panel row.
In the builder, click the edit button  on "Process graph" to open graph settings.

Dashboard builder: opening "Process graph" settings.
To filter events for one employee, enter that project employee record's identifier in "Employee ID (optional)" in the "Employee" block. "Use filter variable" replaces ID entry with a dashboard filter. Employees and their user names are configured in the project.
4. Filter the graph#
For a single-process graph, the sliders in the widget's lower control panel set minimum values for its elements:
- "Nodes" slider
 — hides actions whose occurrence count is below the threshold;
- "Edges" slider
 — hides transitions whose occurrence count is below the threshold.
When comparing two processes, the thresholds use the metric selected in "Metric" in "Widget settings". Available metrics and the path to the dialog are described in "Widget settings".
Move a slider right to simplify the graph, or left to restore hidden elements. These controls change the view without removing source events.
If the filters hide the route's start or finish, a hint asks you to reduce their values. Return the sliders to their starting positions, then increase filtering gradually.
Example: with "Transition count" selected, "Nodes" is moved right. The rare Уточнение данных action is hidden, while the main actions remain visible.

Dashboard, "Process graph" widget: node filtering.
5. Work with cases#
The panel beside the graph lists cases of the selected process. Each row shows:
- number;
- share of the selected data;
- average event count;
- duration.
The "Sort" list offers:
- "Most common" — puts frequent cases first;
- "Least common" — puts rare cases first;
- "Longest time" — puts cases with longer durations first;
- "Shortest time" — puts cases with shorter durations first.
Click a row to show one route. Hold Ctrl while clicking to select several rows. "Select all" includes the entire list, and "Remove all" clears it. "Collapse cases" frees space for the graph. Clicking again restores the panel.
Example: Ctrl-click adds case #6126 to #6127. The graph shows both routes.
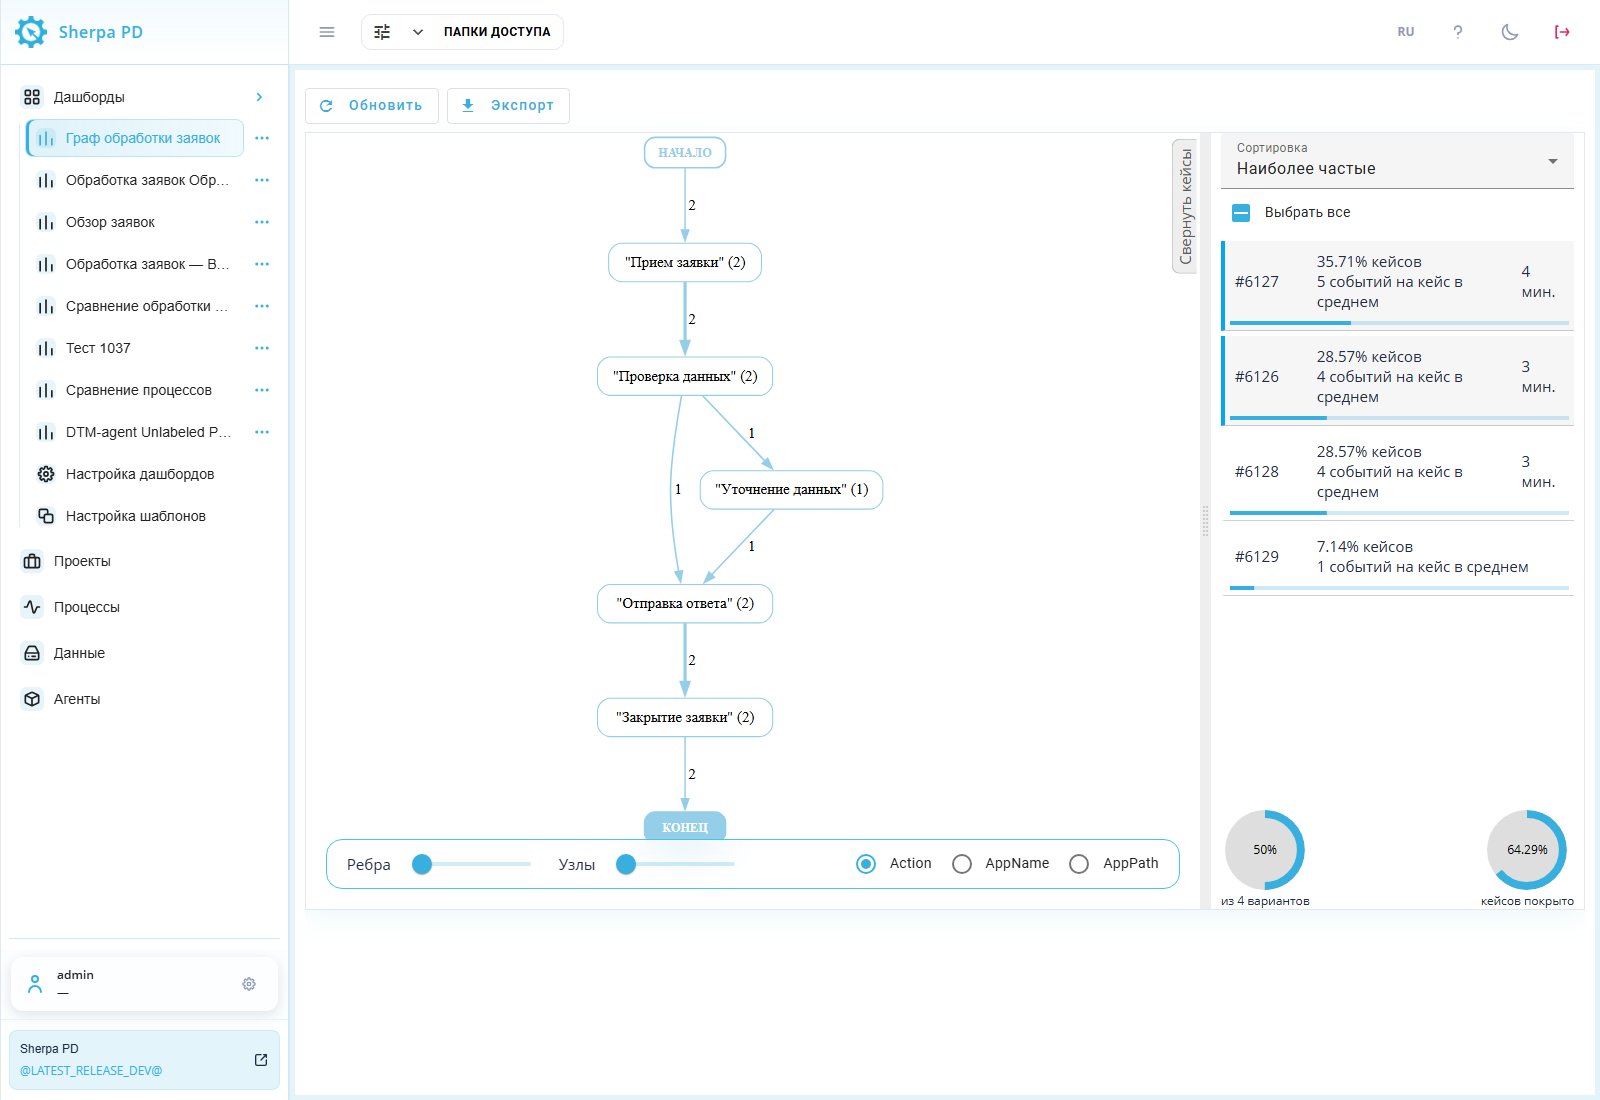
Dashboard, "Process graph" widget: several selected cases.
6. Reference case#
The current "Process graph" widget does not support assigning a reference case. Selecting a row in the case panel displays its route without making it a reference. Comparison uses another process. See "7. Comparison with a reference process" for the selection procedure.
7. Comparison with a reference process#
To compare routes, expand "Dashboards" in the left menu and open Сравнение маршрутов, created from "Base dashboard (example)". Panel creation is described in "1. Build a graph".
The filter panel contains two controls:
- "Process" — selects the actual process;
- "Reference process" — selects another process in the same project for comparison.
Leaving "Reference process" empty disables comparison.
The legend appears above the graph:
- "Match" — solid blue line, present in both processes;
- "Actual process only" — dashed red line, present only in the actual process;
- "Reference process only" — solid green line, present only in the reference process.
Arrows use the legend's colors and line styles. A process cannot be compared with itself. If the graph fails to build, check the selected processes and the message above it.
8. Node and transition details#
Click an action node or a transition arrow to view its source events. A popup named after the selected action or transition opens with an event table. The "start" and "finish" blocks do not open this table.
If a round mark appears in an event row's "ImageGUID" column, click that cell to open the event image.
The table includes:
- event time;
- case number;
- computer;
- application.
Example: clicking Проверка данных opens three events for that action. The table shows source records for that action.
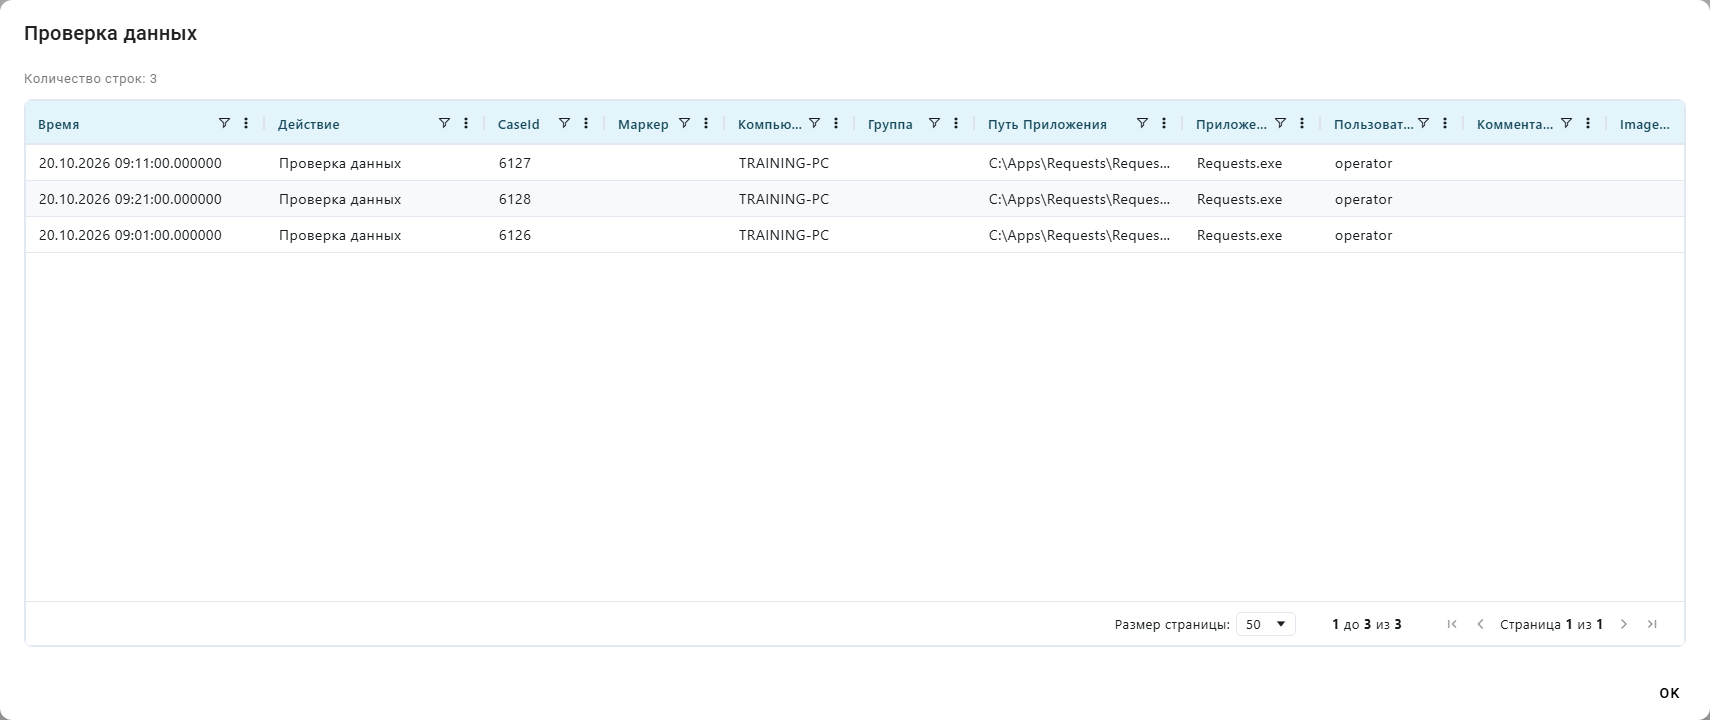
Popup window for "Проверка данных": source events for the selected graph node.
9. BPMN diagram#
A BPMN diagram shows the work sequence in BPMN notation. Open "Processes", choose a project, and select the required process. "Show BPMN schema" above the table opens a dashboard with its "BPMN schema" widget. An existing panel is available by name under "Dashboards" in the left menu.
Example: process Обработка заявок is selected in its project on "Processes". "Show BPMN schema" opens its diagram.
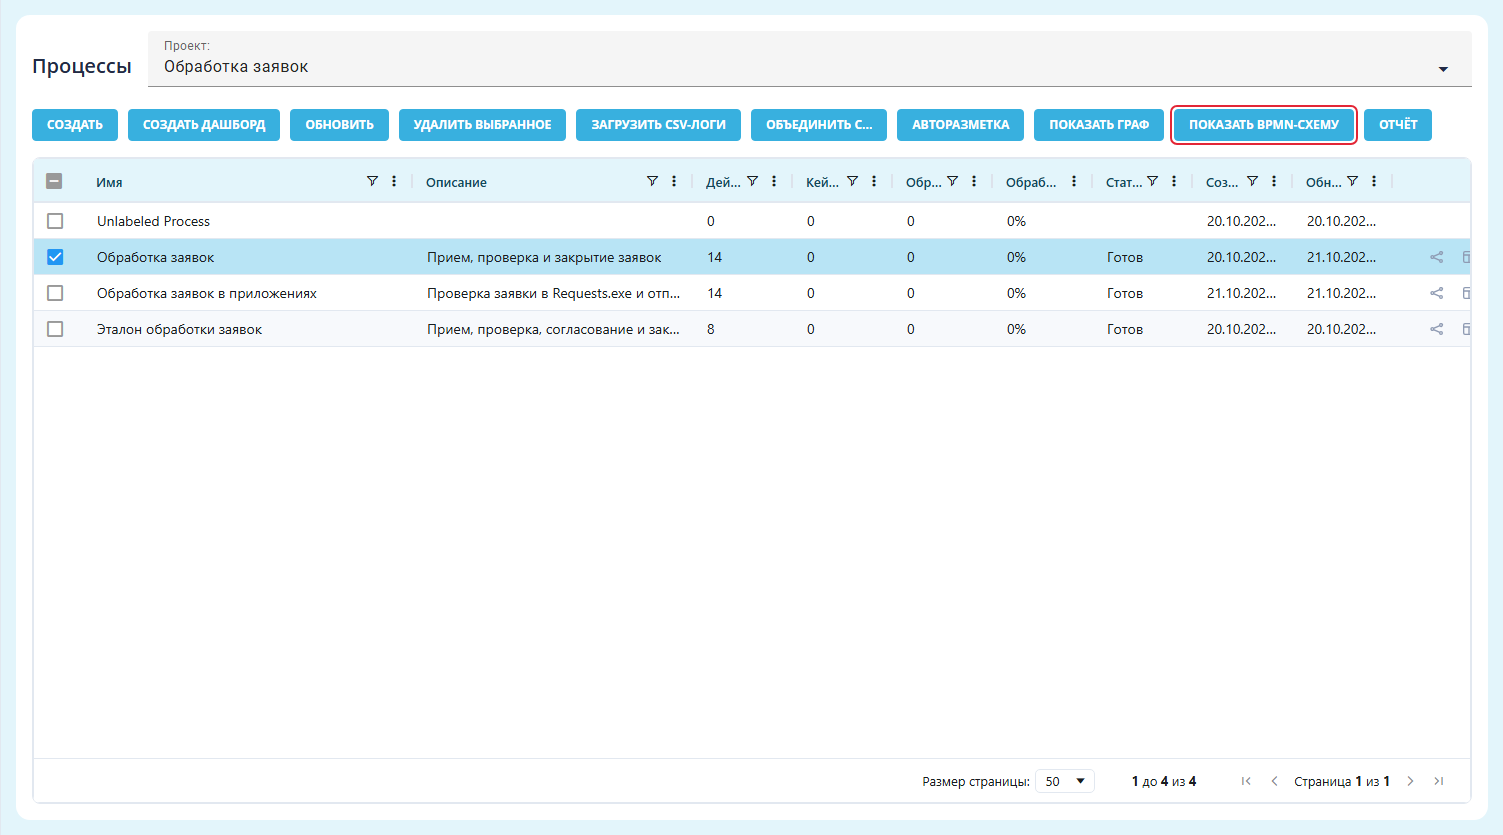
"Processes" screen: "Show BPMN schema" button.
After opening the diagram, case #6126 is selected. The case panel is collapsed and the mouse wheel reduces zoom to show the route from start to finish. See BPMN diagram for details.
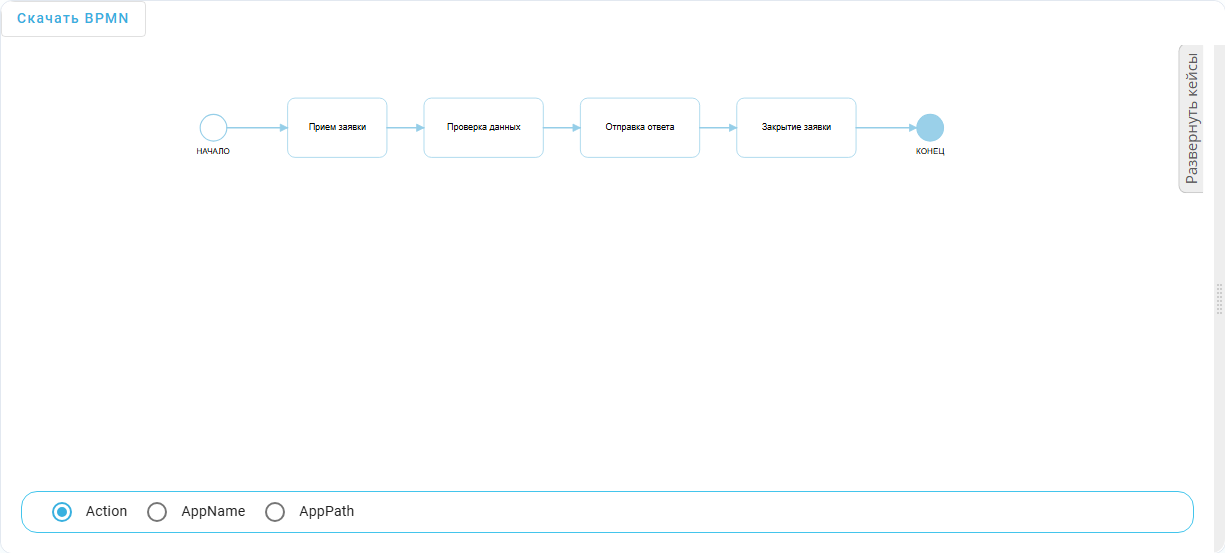
Dashboard, "BPMN schema" widget: request handling sequence.
Widget settings#
In the dashboard builder, click the edit button on the widget. The "Widget settings" popup window controls graph content and process binding. Opening a graph from "Processes" fills the binding automatically.
Required elements:
- "Widget name" — sets the name;
- "Type" — select "Process graph";
- "Process" — identifies the process through "Process ID" or a selected filter variable.
Additional elements:
- "Source parameter" — initial Action, AppName, or AppPath view;
- "Metric" — sets the values beside nodes and arrows;
- "Show cases panel" — displays the list beside the graph;
- "Project" — identifies the project through "Project ID" or a filter variable. If omitted, the project is determined from the process;
- "Reference process" — identifies the comparison process through "Reference process ID" or a filter variable;
- "Employee" — employee-based event filter configuration. Use "Employee ID (optional)" or a filter variable. Employees and user names are configured in the project.
The "Metric" field offers:
- "Transition count" — shows action and transition occurrence counts to compare frequency;
- "Case count" — supports comparison of the number of cases containing actions and transitions;
- "Average transition time" — shows average time to an action or between actions to help locate delays;
- "Median transition time" — shows median transition time so individual long transitions have less effect on the estimate;
- "Average, minimum and maximum time" — shows average, minimum, and maximum transition time to assess the spread of durations.
In each binding block, "Use filter variable" replaces ID entry with an existing dashboard filter. "Save" applies widget settings. "Cancel" closes without saving.
Example: to compare Обработка заявок and Эталон обработки заявок, "Widget name" is Граф обработки заявок, "Type" is "Process graph", "Source parameter" is Action, and "Metric" is "Transition count". The case panel is enabled. "Project ID" is 24, "Process ID" is 41, and "Reference process ID" is 42. "Employee ID (optional)" is empty. All "Use filter variable" switches are off.

"Widget settings" popup window: graph and comparison settings.