
Data#
The Data screen lets you inspect source events and prepare them for analysis by identifying Process boundaries and excluding unwanted records. Events come from Agents or CSV imports. The screen has "Events", "Errors", and "Pending deletion" tabs. In the screenshot, the Project was selected automatically and the remaining filters are still empty.
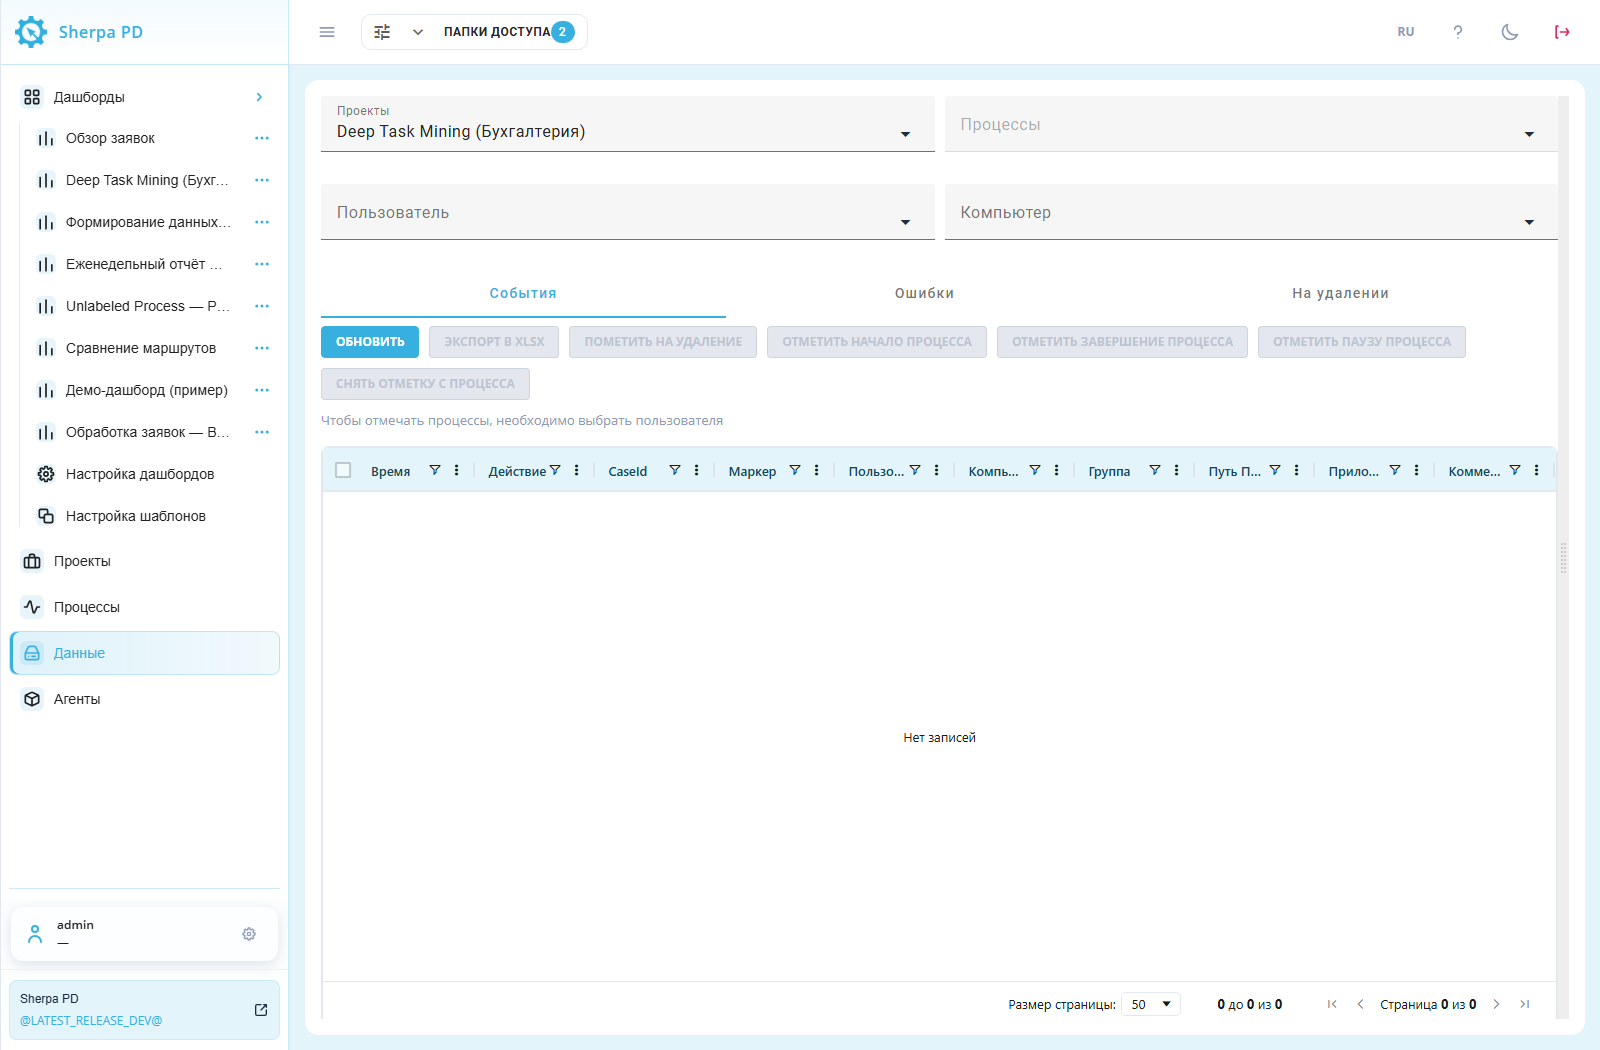
Data screen immediately after opening: navigation and initial workspace. Russian-language interface.
Access rights#
Role permissions define which event operations a User can perform, limiting access to viewing and changing data according to their tasks.
Opening "Data" requires the role permission "Read" in the "Data" row. Manual marking, marking for deletion, and removing deletion marks also require "Update". Configure these permissions in the "Role" popup window, on the "Access" tab.
Example: "Read" and "Update" are selected in the "Data" row to allow inspecting events and correcting markers.

"Role" popup window, "Access" tab: data permissions.
1. Filters and event table#
Filters help find events for the required Project, Process, User, or Computer without inspecting the entire log.
Select records for inspection on the "Events" tab. "Refresh" reloads the list with the selected filters.
Required field:
- "Projects" — project whose events appear in the table.
Additional fields:
- "Processes" — limits the list to one process. Selecting a project automatically selects its first process, so check the process name;
- "User" — limits events to one computer user. This field is required for manual marking in a Task Mining project;
- "Computer" — limits events to one computer.
The process list depends on the project. Available users and computers depend on the selected project and process.
The table shows time, action, case number in "CaseId", marker, user, computer, group, application path, application, and comment. Column filters help find a record. Columns support sorting and resizing. Event time matches the source log and is not converted to the browser's time zone.
Example: Обработка заявок is selected in both "Projects" and "Processes", operator in "User", and TRAINING-PC in "Computer". The table shows 14 events from 20 October 2026.
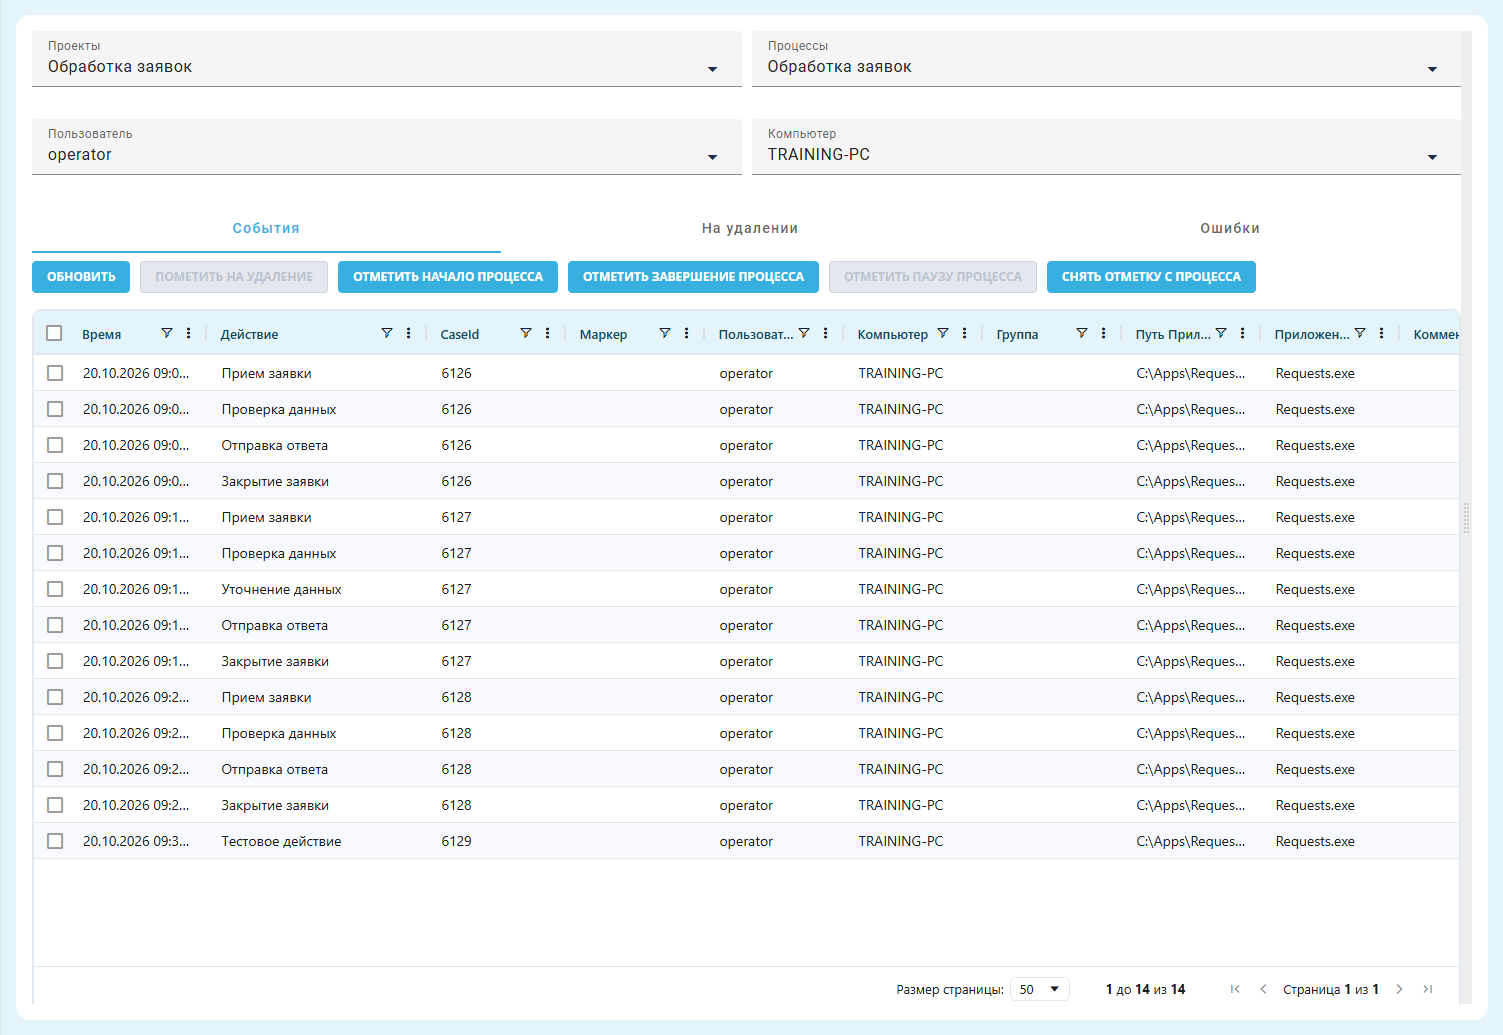
"Data" screen, "Events" tab: filters and table.
2. View event details#
Event details let you inspect the original record values and understand which action was recorded.
Click a row to open its fields in the panel on the right. Drag the divider to resize the panel and table. Closing the panel restores table space and clears row selection.
If the agent supplied an event image, it appears in the panel. Clicking it opens the gallery. If no image exists, the viewing area remains empty.
Example: the selected Прием заявки event shows its time, user, computer, and Requests.exe application. This record has no image.
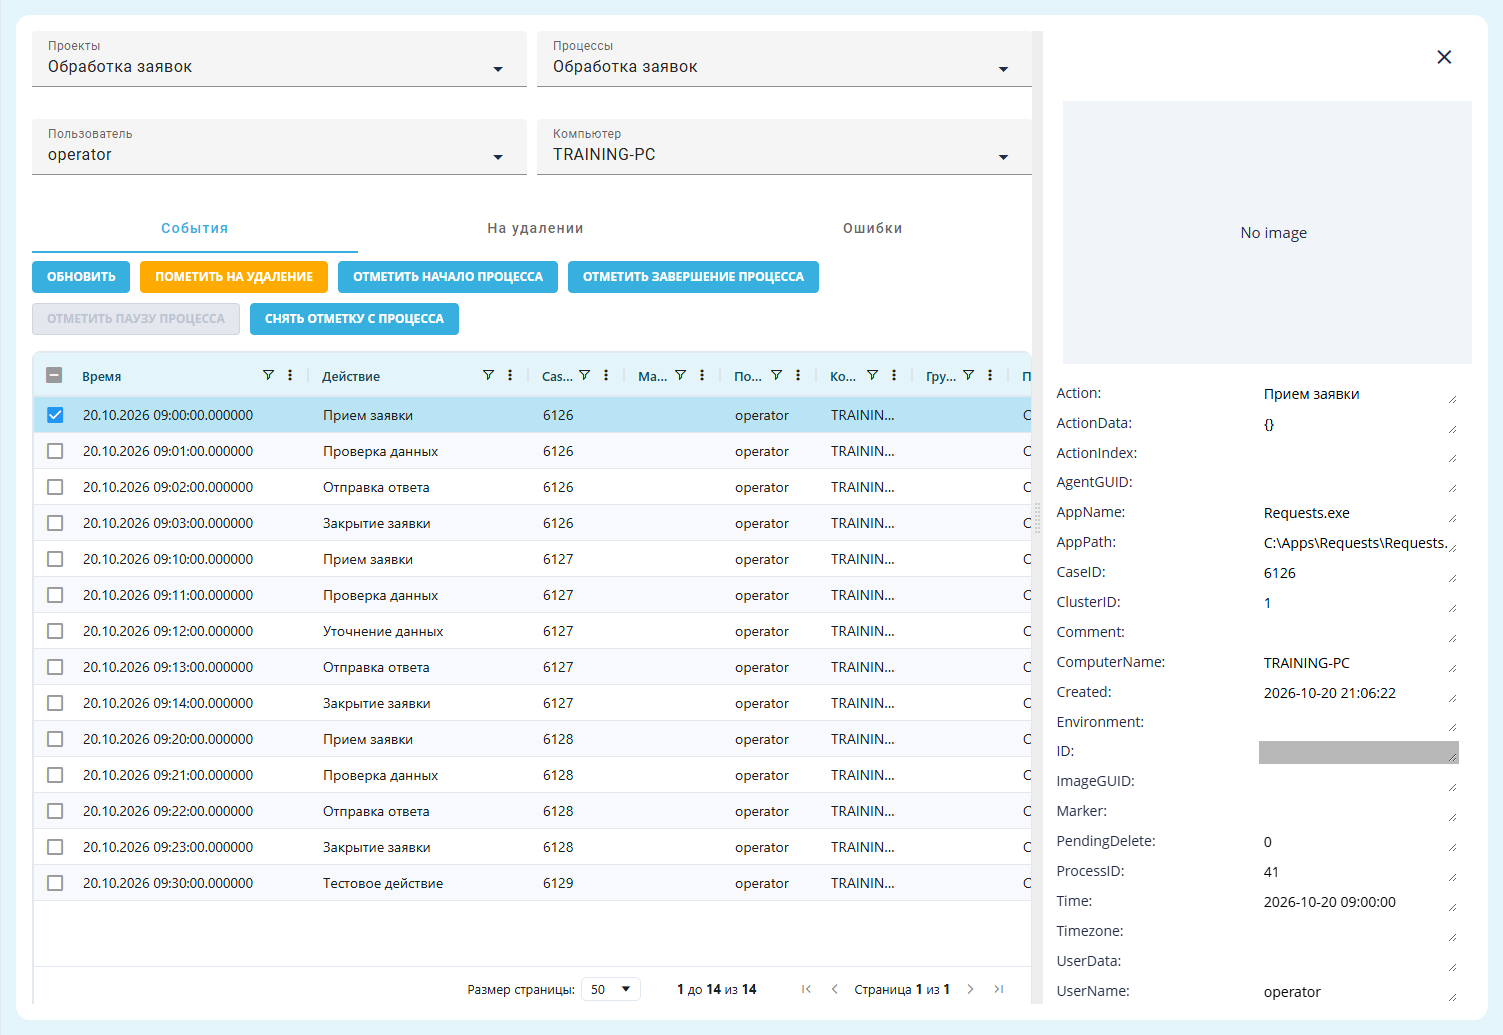
"Data" screen, "Events" tab: event details panel.
3. Manually label a process#
Manual marking identifies the start, pause, and finish of a Process so that you can analyze the required action sequence.
Four buttons above the table on the "Events" tab are used for manual marking:
- button "Mark Process Start";
- button "Mark process pause";
- button "Mark Process Finish";
- button "Unmark Process";

Data screen, Events tab: the four manual-marking buttons above the table. Russian-language interface.
"Process name" field#
The "Process name" field links start, pause, and finish markers to the same action sequence.
In a Task Mining project, first select "User" above the table. The selected row must match this filter and the selected computer, if specified.
The "Set process name" popup window opens when adding a start, pause, or finish marker so that you can enter or select its name.
Required field:
- "Process name" — links markers belonging to one sequence. For a start, enter a new name or choose a previously used name. For a pause, choose an unfinished sequence. For a finish, choose a previously started sequence. The most recently started name is selected first for a finish.
"OK" saves the selected event's marker. "Cancel" closes the window without changing the record.
Example: Обработка заявки is entered in "Process name" for the Прием заявки event at 09:00. Enter confirms the input, enabling "OK".
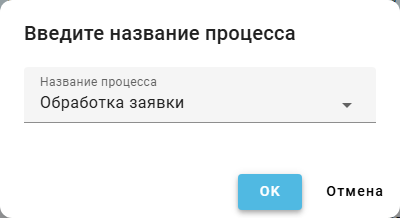
"Set process name" popup window: name for a start marker.
"Mark Process Start" button#
A start marker identifies the event at which Process execution begins.
Select the first event and click "Mark Process Start". Enter the name and save. A Start marker appears in "Marker", and the row turns green.
Example: Прием заявки at 09:00 is marked as the start of Обработка заявки.

"Data" screen, "Events" tab: process start marker.
"Unclosed process" popup window#
The unclosed-process warning helps you notice that the previous sequence still has no finish marker.
If the previous sequence has not finished, marking a new start opens the "Unclosed process" popup window. "OK" marks the previous sequence's finish on the action immediately before the new start, then opens the window for the new process name. "Cancel" leaves markers unchanged.
Example: after starting Обработка заявки at 09:00, the event at 09:10 is selected and "Mark Process Start" is clicked. The warning explains that the previous sequence still needs a finish.
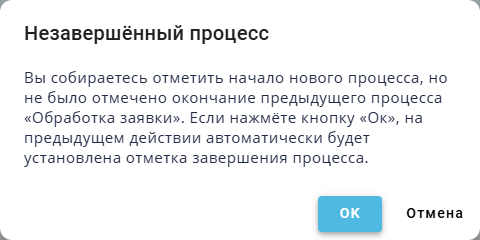
"Unclosed process" popup window.
"Mark process pause" button#
A pause marker distinguishes an interruption from the end of a Process.
"Mark process pause" marks a temporary interruption within one case. It is available when a sequence has started but not finished. Select an event, choose the sequence name, and save. Pause appears in "Marker".
Example: Проверка данных at 09:01 is marked as a pause in Обработка заявки.

"Data" screen, "Events" tab: process pause marker.
"Mark Process Finish" button#
A finish marker identifies the last Process action and separates it from subsequent events.
Select the final event and click "Mark Process Finish". Choose the name and save. Finish appears in "Marker", and the row turns pink. Rows between the start and finish gradually change from green to pink.
Example: Закрытие заявки at 09:03 finishes Обработка заявки, which started at 09:00.

"Data" screen, "Events" tab: start, pause, and finish markers.
"Unmark Process" button#
Removing a marker corrects erroneous labeling while keeping the event in the log.
"Unmark Process" clears the selected row's marker. The event remains in the log. Repeat for each row whose marker needs correction.
Example: markers are removed from the events at 09:00, 09:01, and 09:03. "Marker" is empty again, and all 14 events remain in the table.
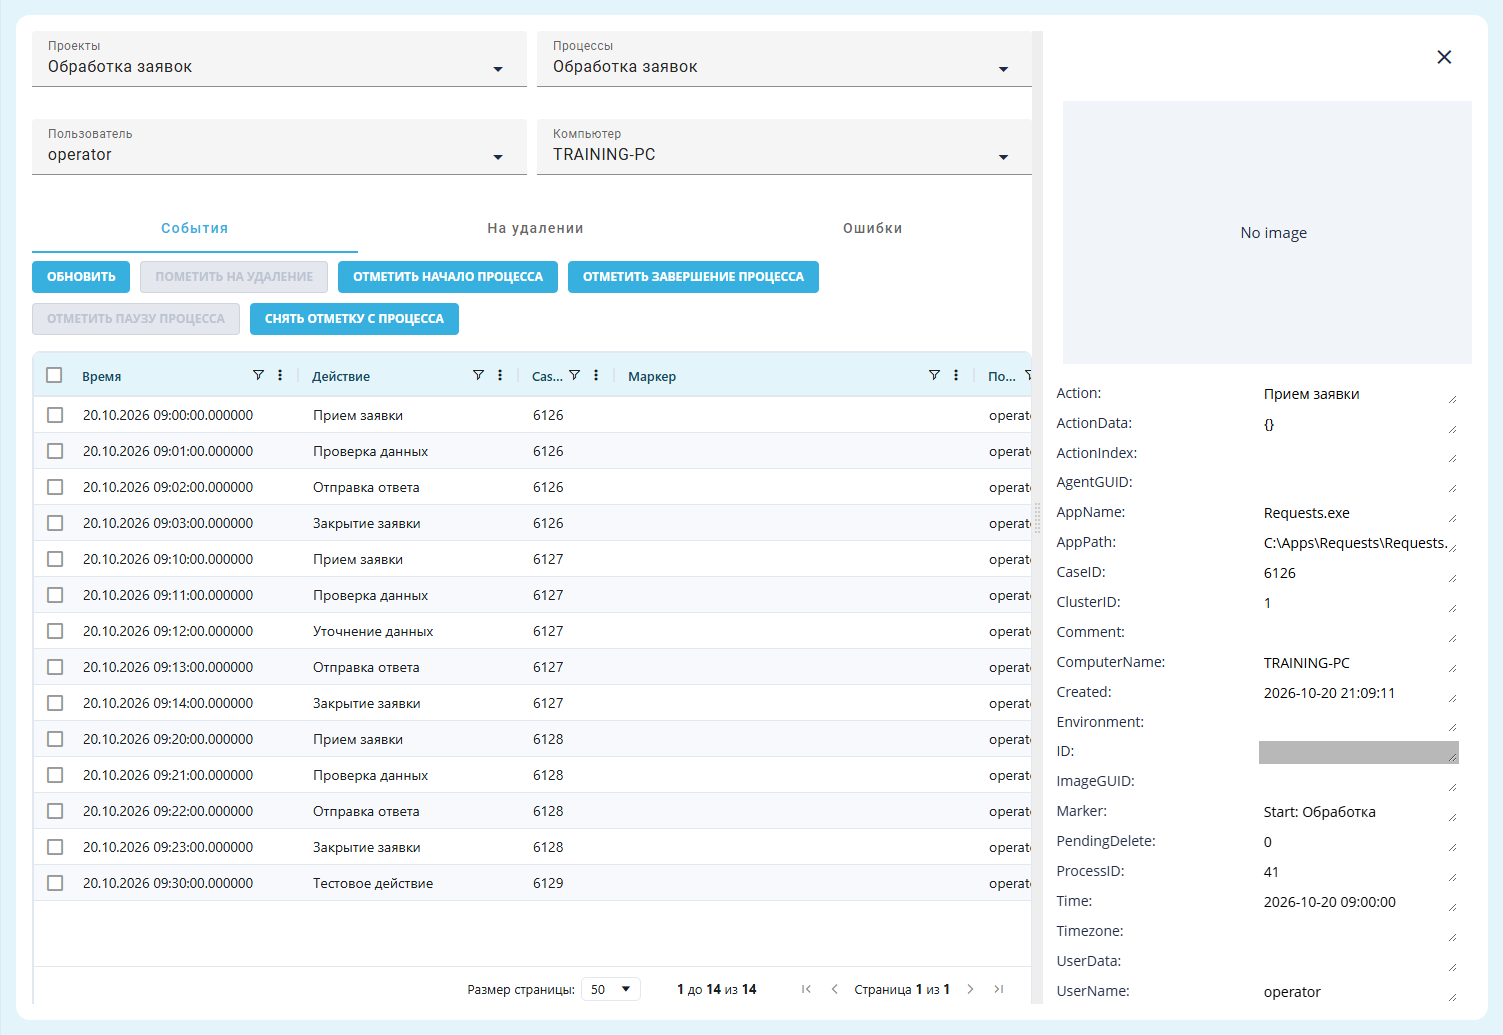
"Data" screen, "Events" tab: rows without process markers.
Marking for deletion#
Marking excludes incorrect or unwanted events from the main list and analytics. The mark can be removed before permanent deletion.
- On "Events", select the project and check the other filters.
- Select the required rows using their checkboxes.
- Click "Mark for deletion".
Example: only Тестовое действие at 09:30 is selected to exclude the training record.
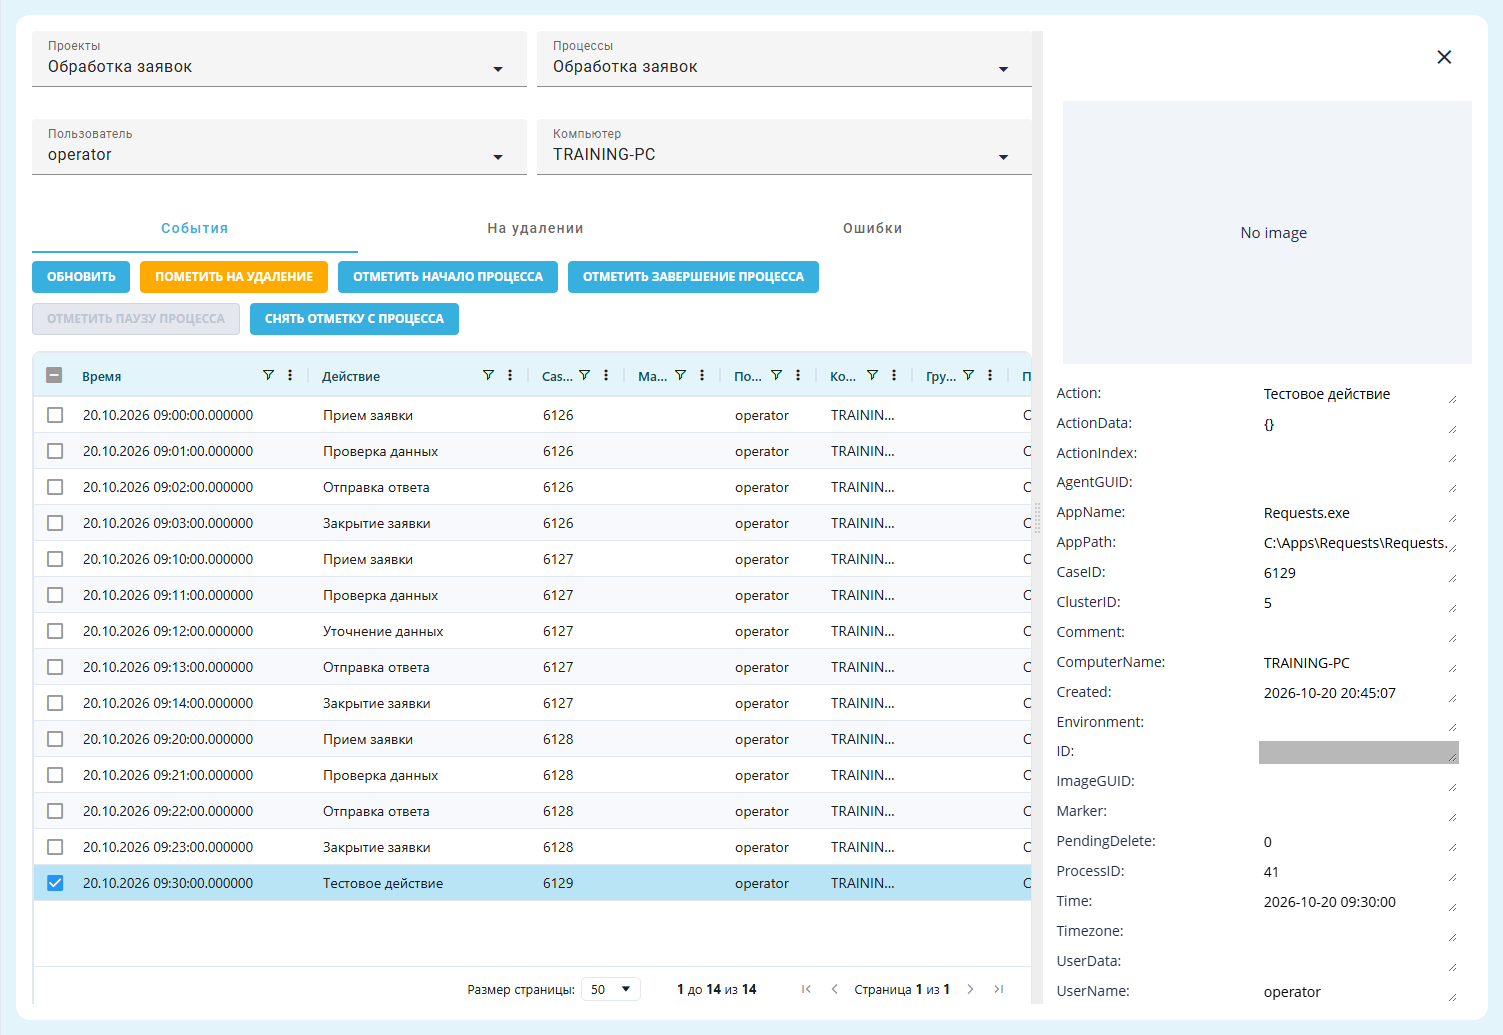
"Data" screen, "Events" tab: selecting a row for deletion marking.
Check the row count in the "Mark rows for deletion?" popup window. "CONFIRM" applies the mark. "Cancel" cancels the action. Confirmed rows move to "Pending deletion".
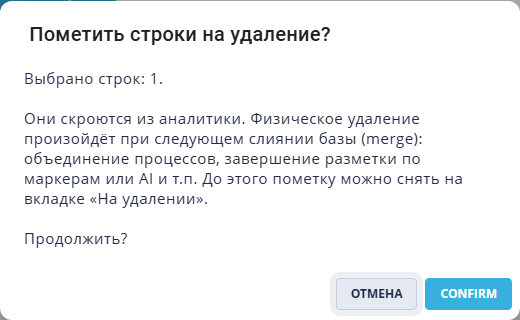
"Mark rows for deletion?" popup window: confirming one row.
Important: the next database merge permanently deletes marked records and their images. A merge occurs, for example, when processes are merged or marker/AI labeling finishes. Check "Pending deletion" and remove incorrect marks before starting these operations.
Removing a deletion mark#
Removing a deletion mark returns events excluded by mistake to the main list and analytics.
"Pending deletion" lists excluded events. Select their checkboxes and click "Remove deletion mark" to restore them.
Example: Тестовое действие is selected on this tab. It stays absent from the main list until its mark is removed.
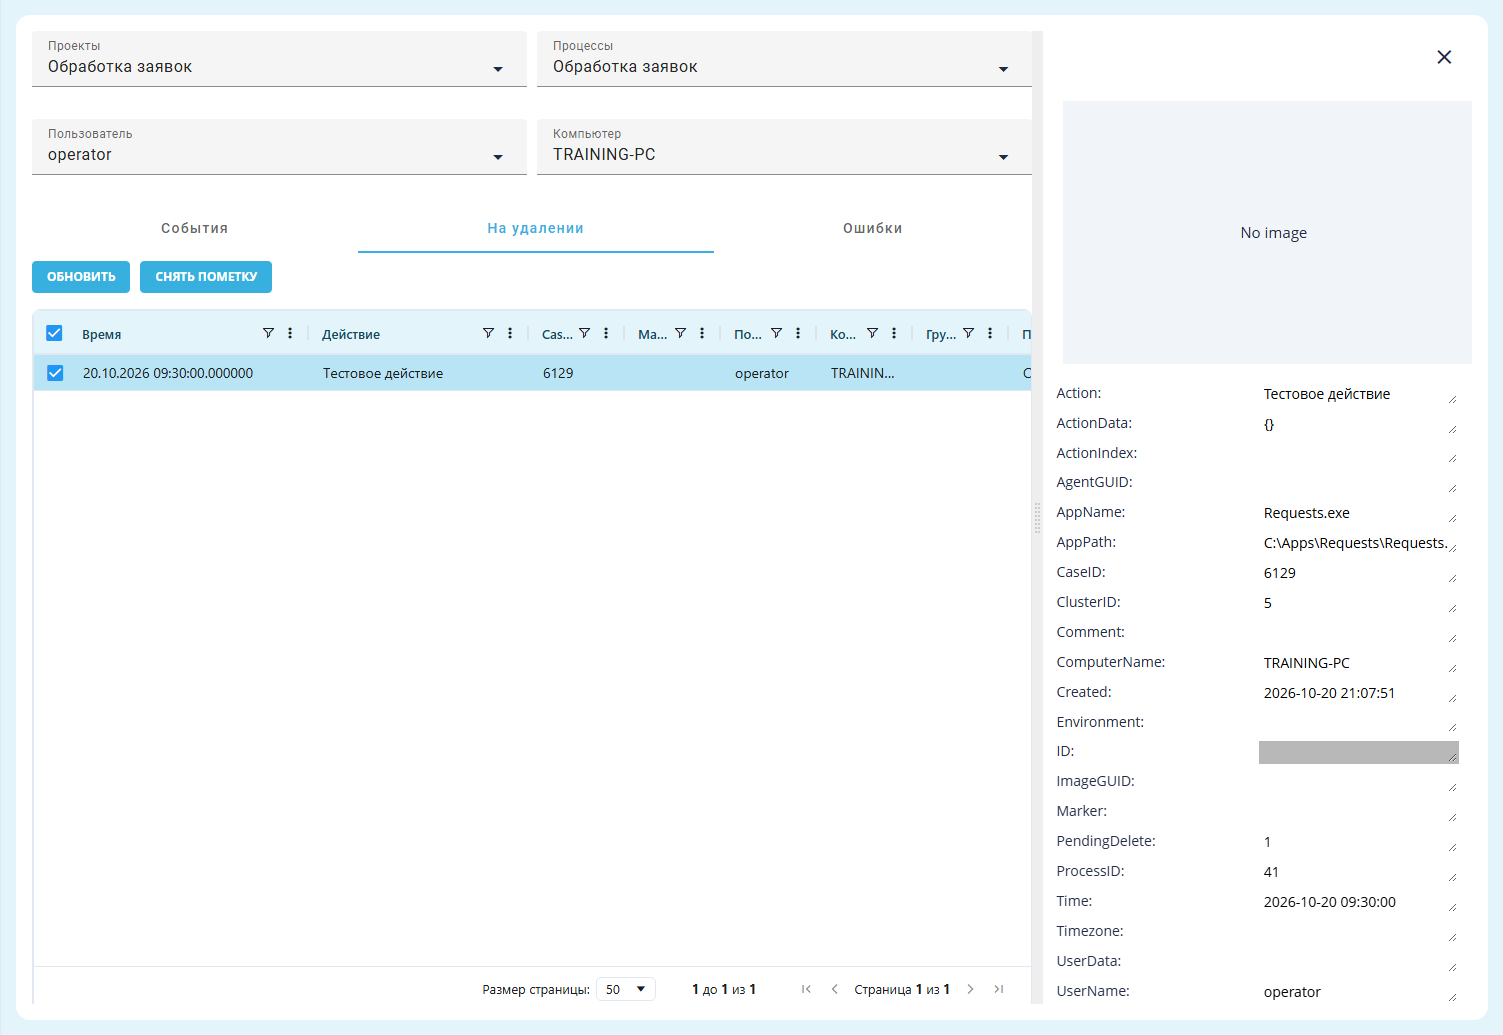
"Data" screen, "Pending deletion" tab: selecting a row to restore.
In "Remove deletion mark?", "CONFIRM" restores the records. "Cancel" leaves them on this tab. After confirmation, the event returns to "Events" and analytics.
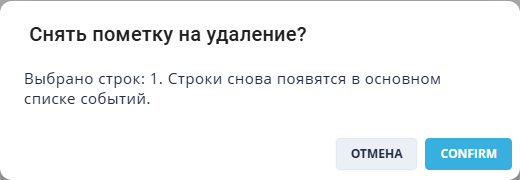
"Remove deletion mark?" popup window: confirming restoration.
Import errors#
Import errors help identify records missing from the data so that they can be corrected and imported again.
The "Errors" tab shows records that could not be imported from an agent or file. The table includes the row number, reason, status, source, details, and original data. "Refresh" reloads the list.
Error reasons include invalid date and time, a duplicate event, a JSON parsing error, a save failure, and a missing project identifier.
Viewing requires the role's "Read" permission in the "Data" row. Editing, reimporting, and skipping also require "Update". The following actions are available for a selected row:
- "Edit" opens the event fields as a flat list. Nested keys are separated by a dot. Changes must be saved after editing;
- "Send to import" sends the record to the processing queue and removes it from the current error list. If import fails again, a new entry appears;
- "Skip" marks the record as skipped. Reimport is unavailable for a skipped record.
To work with an individual error, select the checkbox of one row. Editing, sending to import, and skipping are unavailable when several records are selected. Check the selected project and process before correcting the record.
Before reimporting, check Time and the other required values. The date must use an accepted format, and numeric identifiers in text columns must be stored as text.
The Time field accepts a value in the format 2026-10-30 09:00:00.000000. Save the correction before sending the record to import. After the queue has been processed, check the result on the "Events" tab with the intended project and process selected. Submission to the queue alone does not confirm a successful import.
If the buttons remain unavailable for the next selected error after sending a record to import, reload the page, select the project and process again, open the "Errors" tab, and select the checkbox of the intended row. Processing can then continue. Check the selected record before each action.
Example: events for Обработка заявок were imported without errors. The tab displays "No records".

"Data" screen, "Errors" tab: import completed without errors.