
Dashboards#
Dashboards combine tables, indicators, and diagrams for work analysis. Select an existing dashboard in the "Dashboards" menu. Use "Customize Dashboards" to create and edit panels, and "Customize Templates" to prepare reusable widget sets.

Dashboards screen: Обзор заявок dashboard after opening. Russian interface.
Access rights#
Access rights determine which dashboard and template operations a user can perform.
Configure dashboard permissions on the Roles screen, in the "Role" popup window, on "Access", in the "Dashboards" row:
- viewing and exporting — "Read";
- creating, cloning, and importing — "Create";
- editing names, widgets, and appearance — "Update";
- deleting — "Delete".
Selecting projects and processes requires "Read" in the "Projects" and "Processes" rows of the same window.
Example: "Create", "Read", and "Update" are checked in "Dashboards", and only "Read" in "Projects" and "Processes". These permissions allow creating and editing the panel.
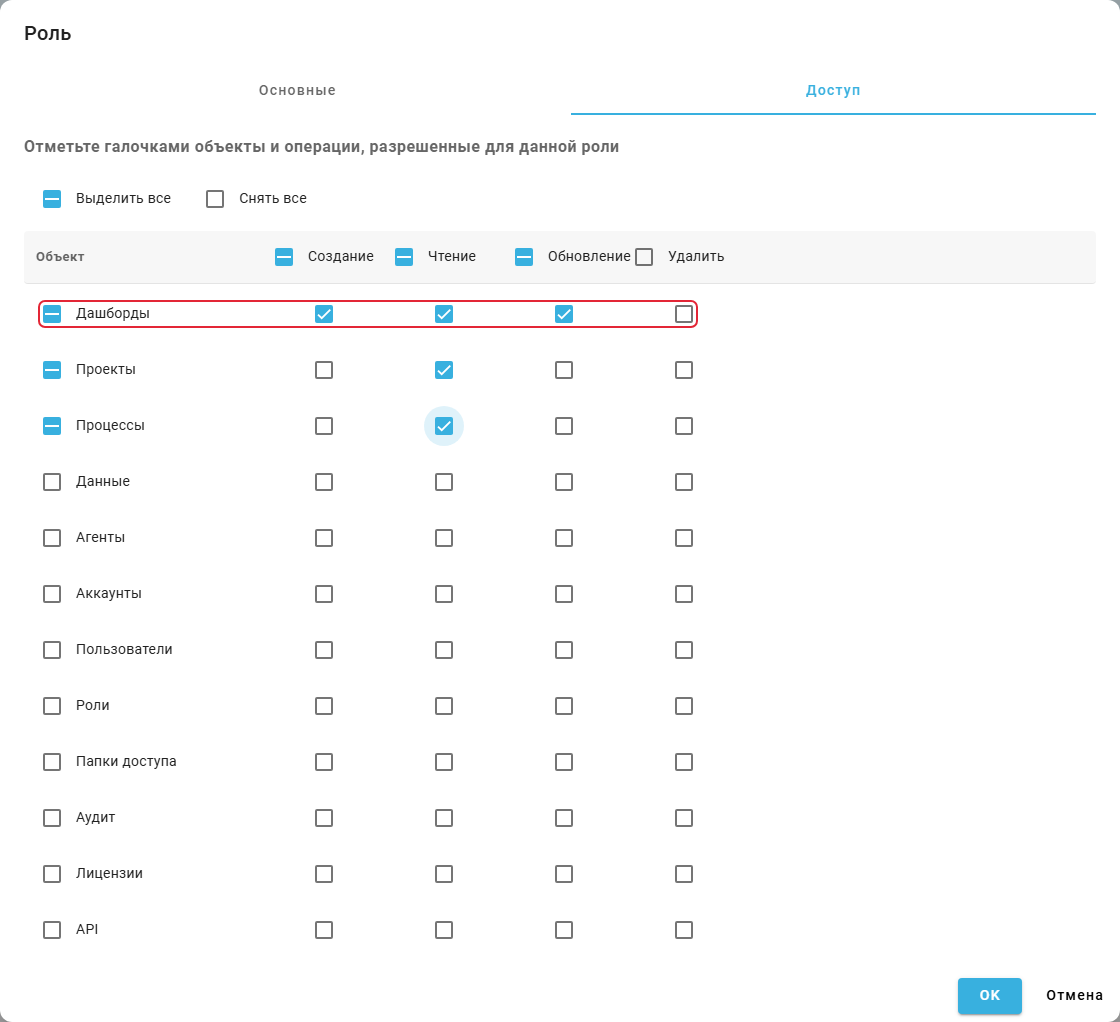
"Role" popup window, "Access" tab: dashboard permissions.
1. Viewing a Dashboard#
Viewing a dashboard lets you assess process metrics and change filters without editing the panel.
Expand "Dashboards" in the left menu and select a name. View mode allows changing variable filter values used by other widgets. "Refresh" reloads the data. Use the Dashboard Designer to change widget composition and layout.
Example: the dashboard shows five request actions, a count of 14 events, and the Лимит строк filter with value 5.
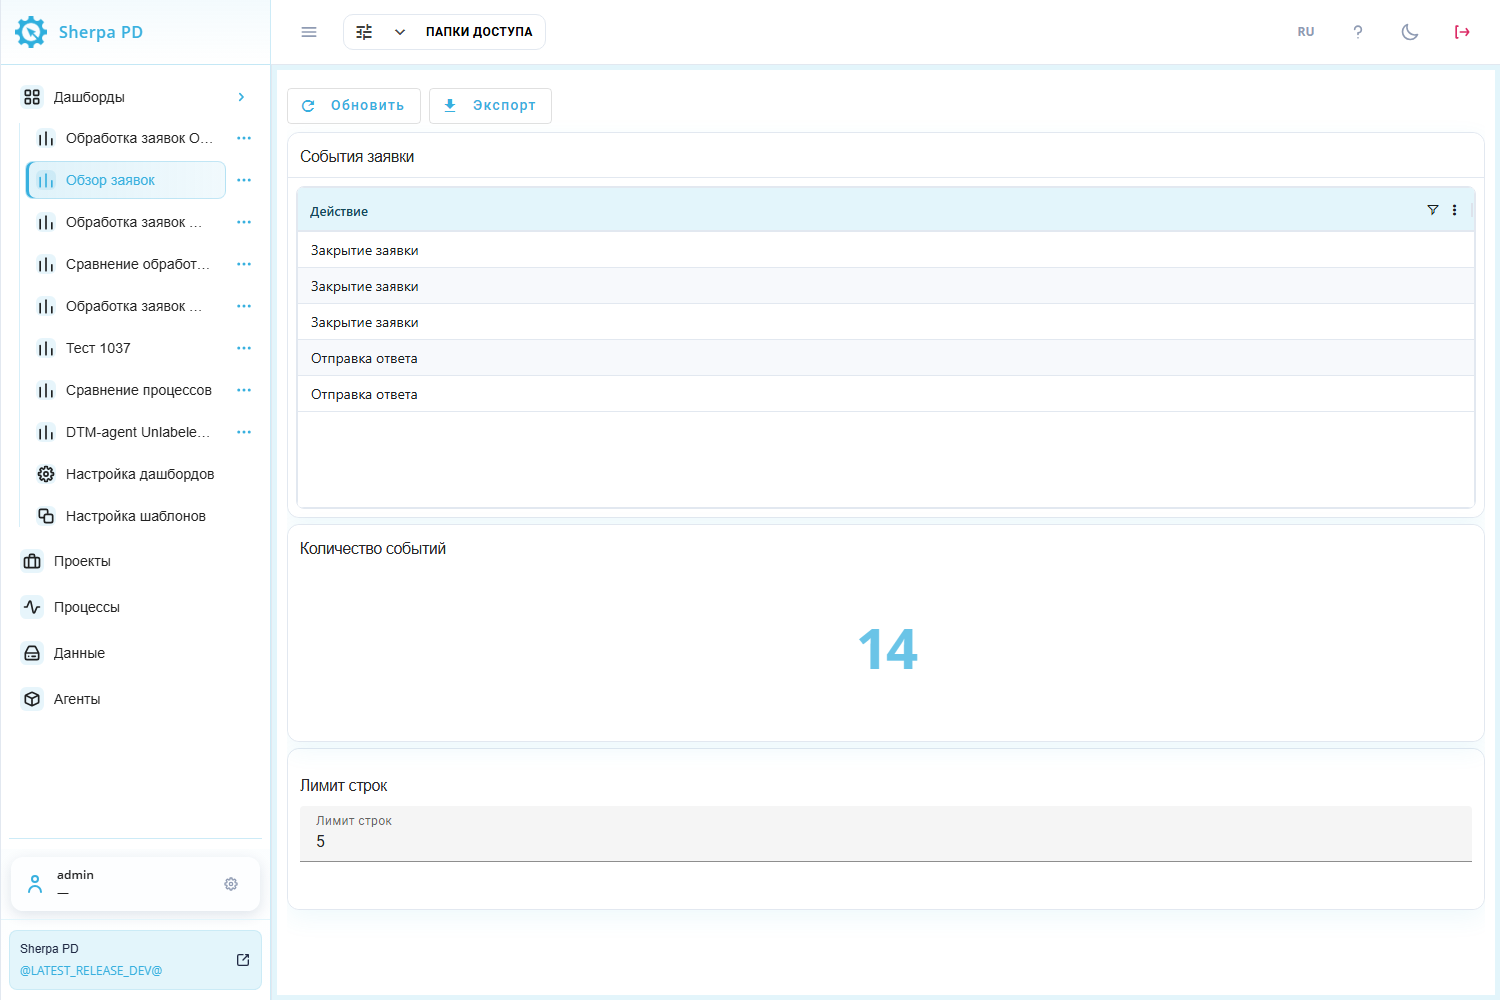
Dashboard: viewing a table, number, and variable filter.
2. Dashboard Registry#
The dashboard registry helps you find a panel and manage its configuration.
"Customize Dashboards" lists "Name", "Description", "Created", and "Updated". Column filters help find a panel. Row checkboxes select records for group actions.
Buttons above the table:
- "New" — opens a new empty dashboard form;
- "From template" — opens ready-made widget sets;
- "Delete Selected" — deletes selected dashboards after confirmation;
- "Clone Dashboard" — copies selected dashboards;
- "Export JSON" — saves selected dashboard configurations to a file;
- "Import JSON" — loads configurations from a JSON file;
- "Create template from…" — creates a template from one selected dashboard. Its name is added to the button label.
Each row has "Edit"  , "Form Designer"
 , and "Delete"
 buttons. JSON transfers configurations between environments and provides backups. It does not transfer process events.
Example: the "Name" column filter leaves only Обзор заявок. Its checkbox is selected for group actions.
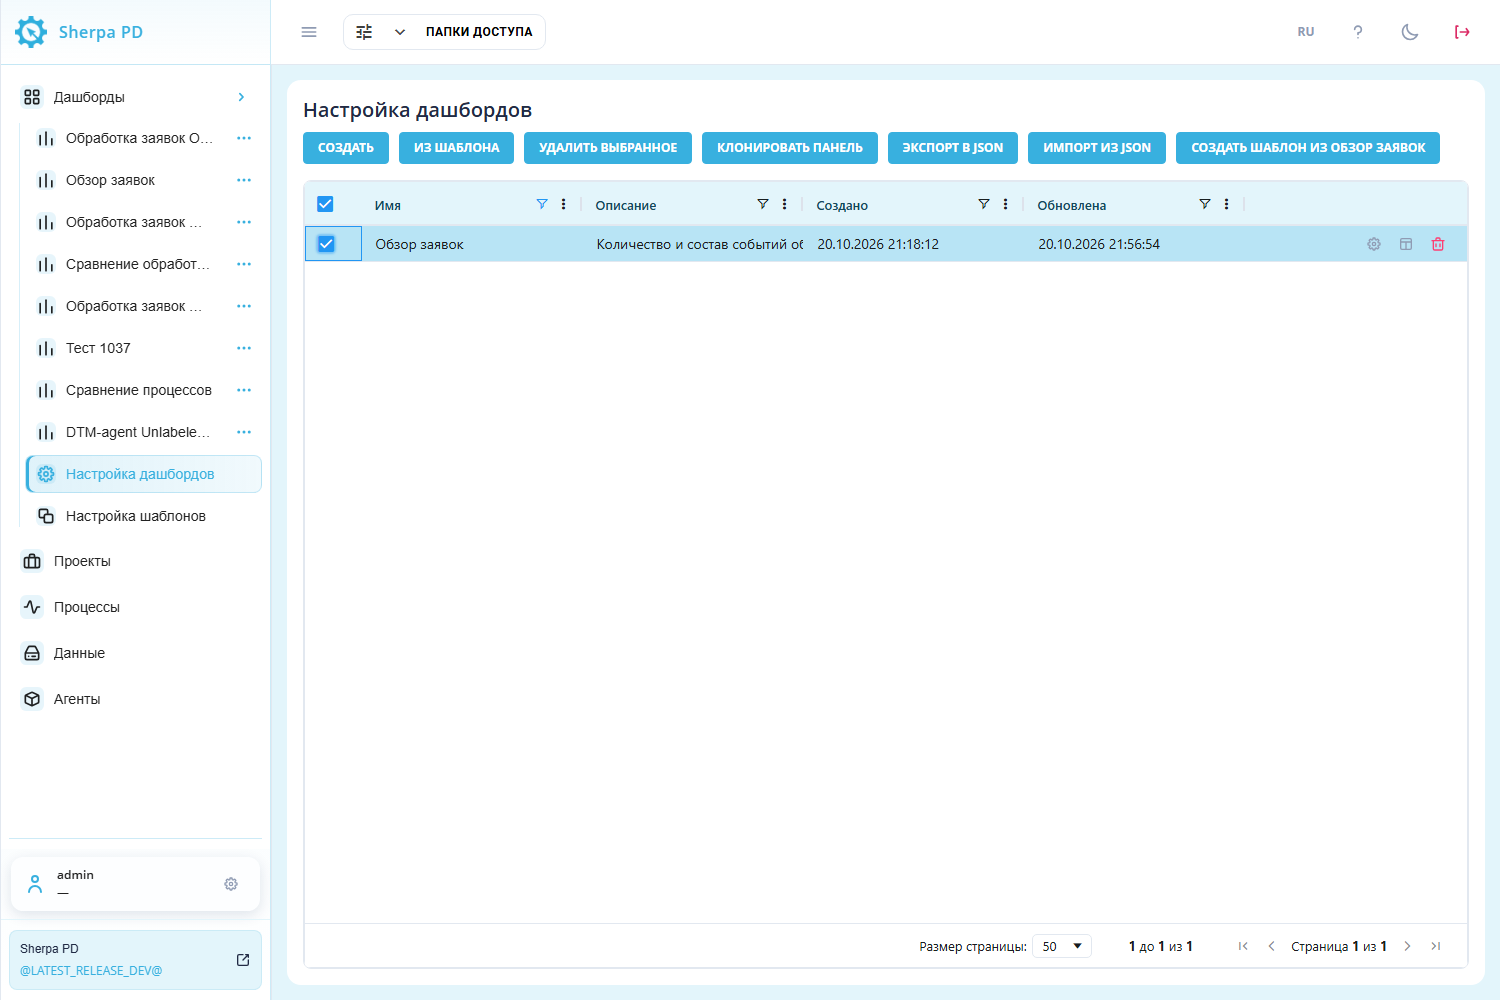
"Customize Dashboards" screen: selecting a dashboard configuration.
To rename a dashboard directly in the registry, double-click its "Name" cell, enter the new name, and press Enter. The change saves automatically. Esc cancels the edit.
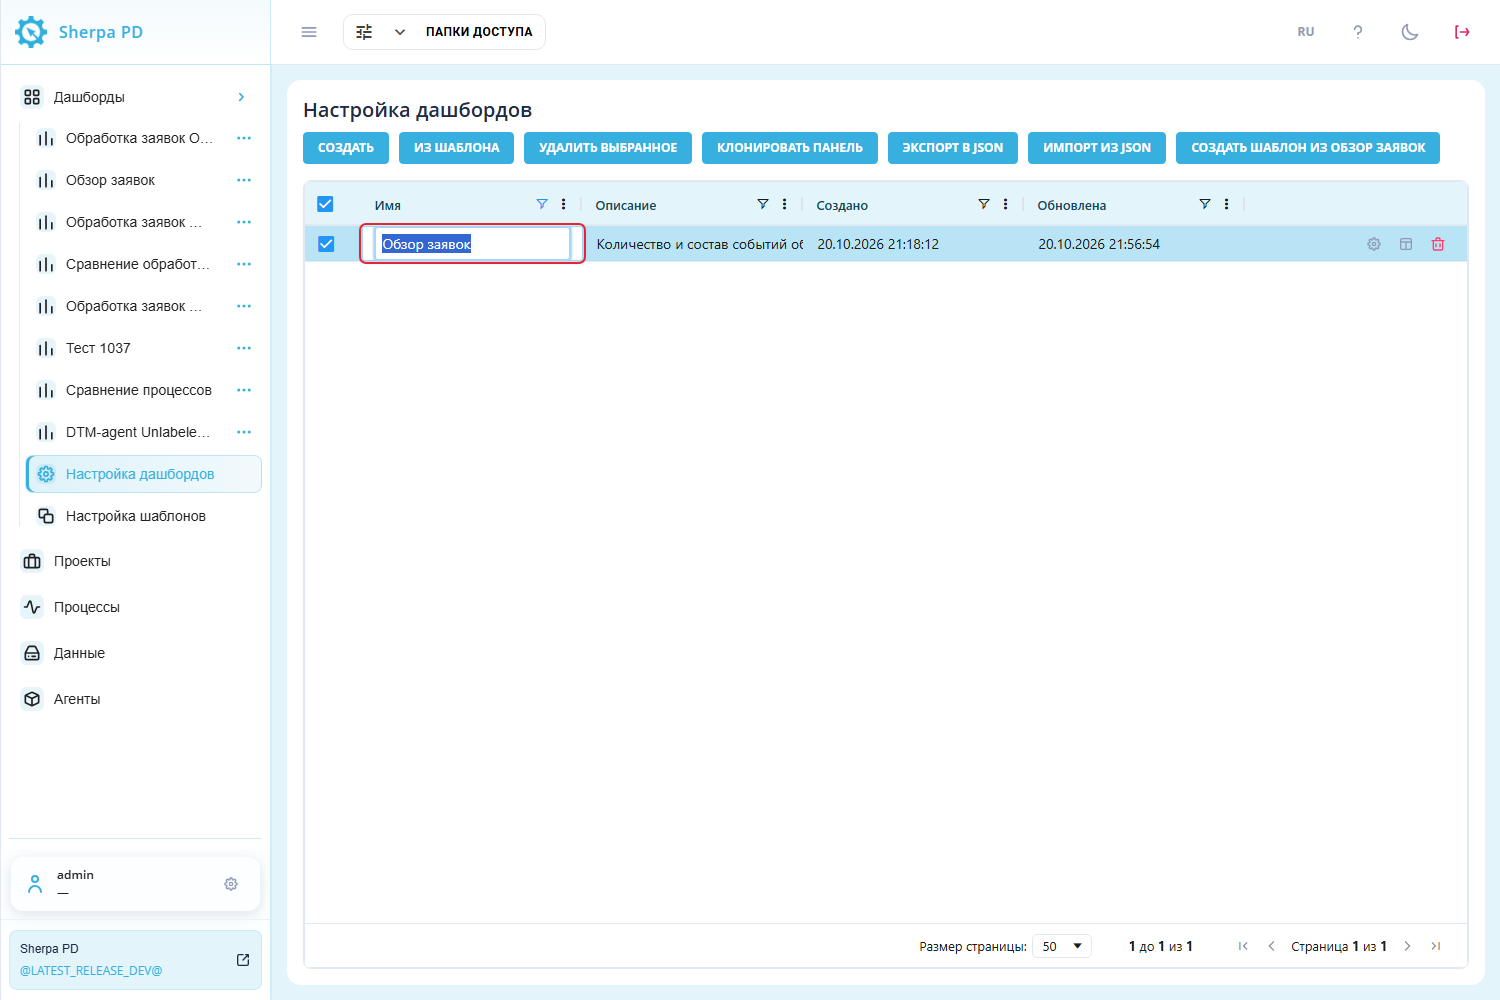
"Customize Dashboards" screen: editing the "Name" cell.
3. Creating an Empty Dashboard#
An empty dashboard lets you choose widgets for your own task.
"New" button#
"New" opens the "Create new dashboard" popup window.
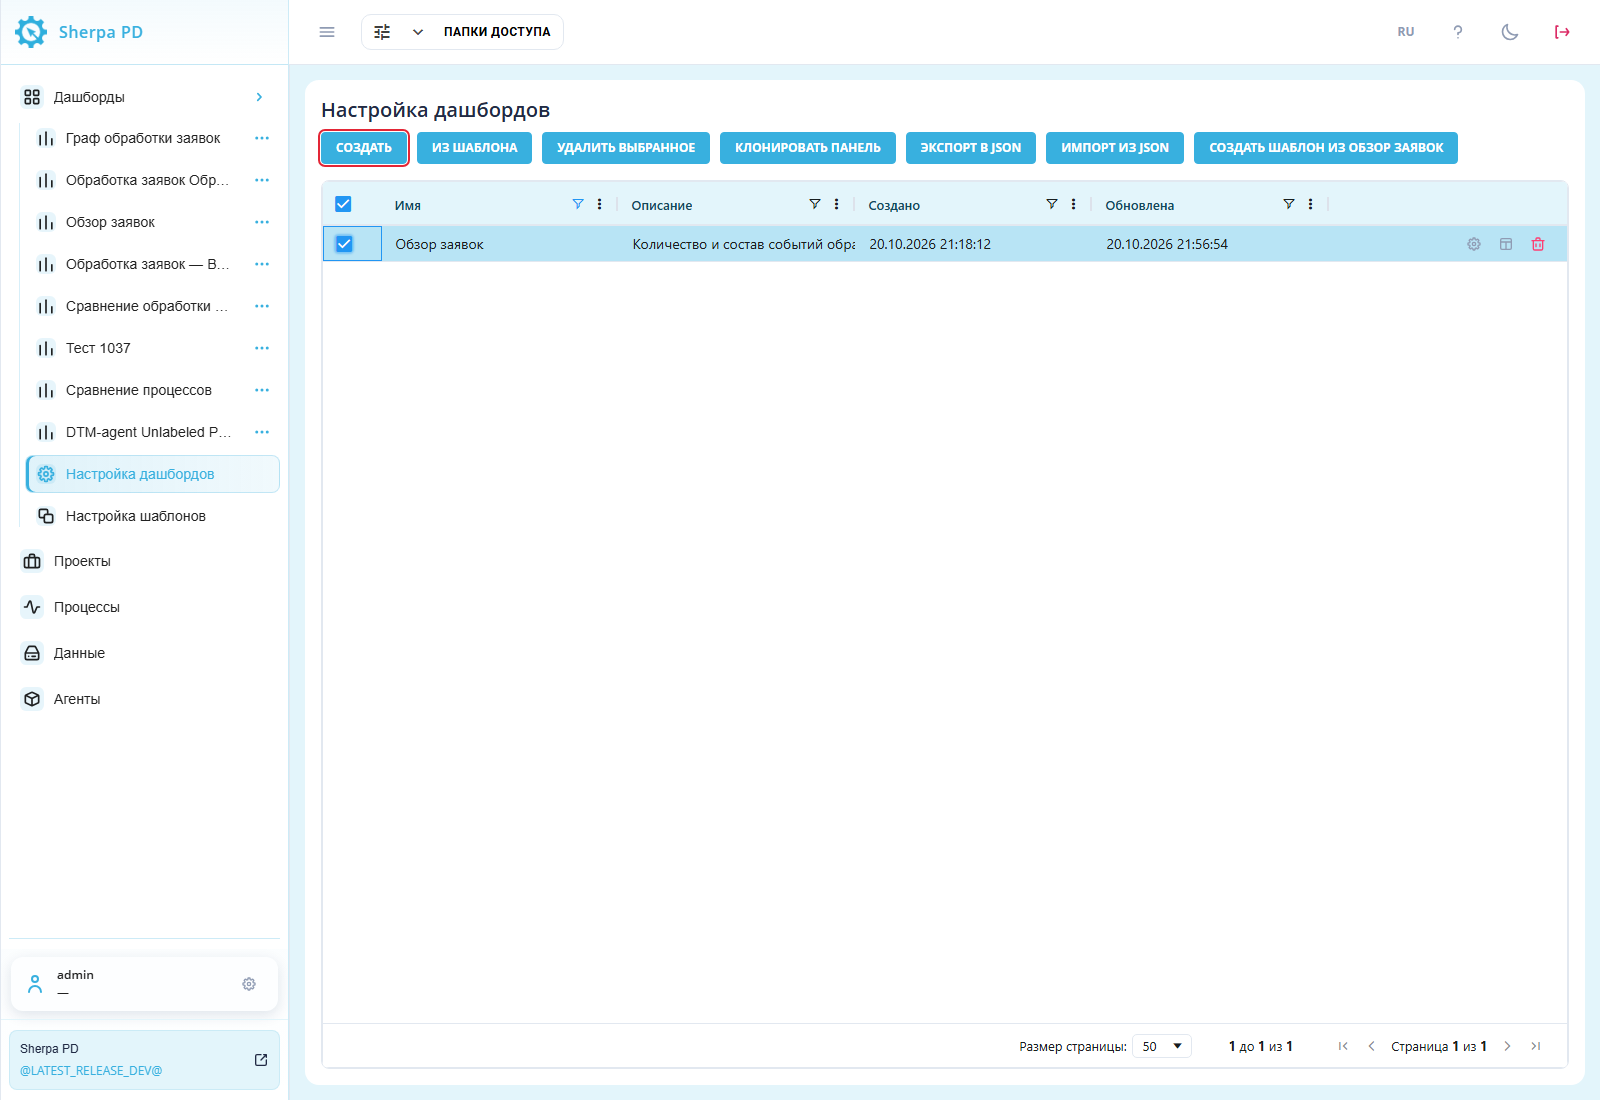
"Customize Dashboards" screen: "New" above the registry.
An empty panel is not bound to a project or process automatically. Add widgets after saving it.
Required fields:
- "Name*" — dashboard name, up to 64 characters.
Additional fields:
- "Access folder" — restricts access through the selected folder;
- "Description" — explains the panel's purpose.
"OK" creates the panel. "Cancel" closes without creating it.
Example: "Name*" is Обзор заявок and "Description" is Количество и состав событий обработки заявок. No access folder is selected.
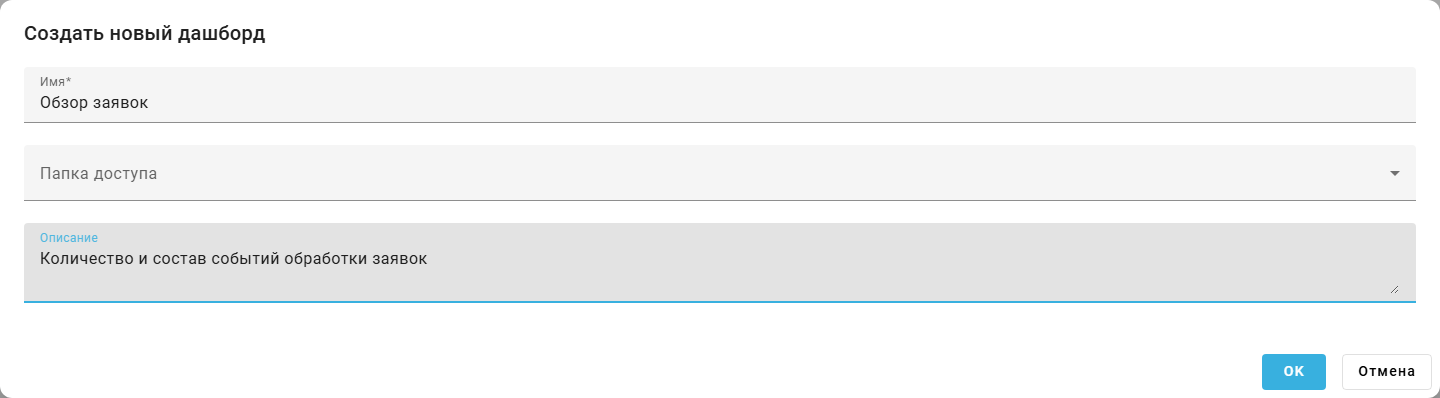
"Create new dashboard" popup window: completed fields.
4. Creating from a Template#
Creating from a template provides a prepared set of widgets to adapt to your data.
"From template" button#
"From template" opens a popup window with separate predefined and user template groups.

"Customize Dashboards" screen: "From template" above the registry.
"Create" beside a template creates a dashboard with its widgets, layout, queries, and variables.
Example: Шаблон обработки заявок is available in the user templates group. A dashboard with an event table, counter and row-limit filter can be created from this template. Click "Create" in the selected template row to create that dashboard.

"From template" popup window: predefined and user templates.
Creating a dashboard for a process#
On "Processes", choose a project, select one process, and click "Create Dashboard".
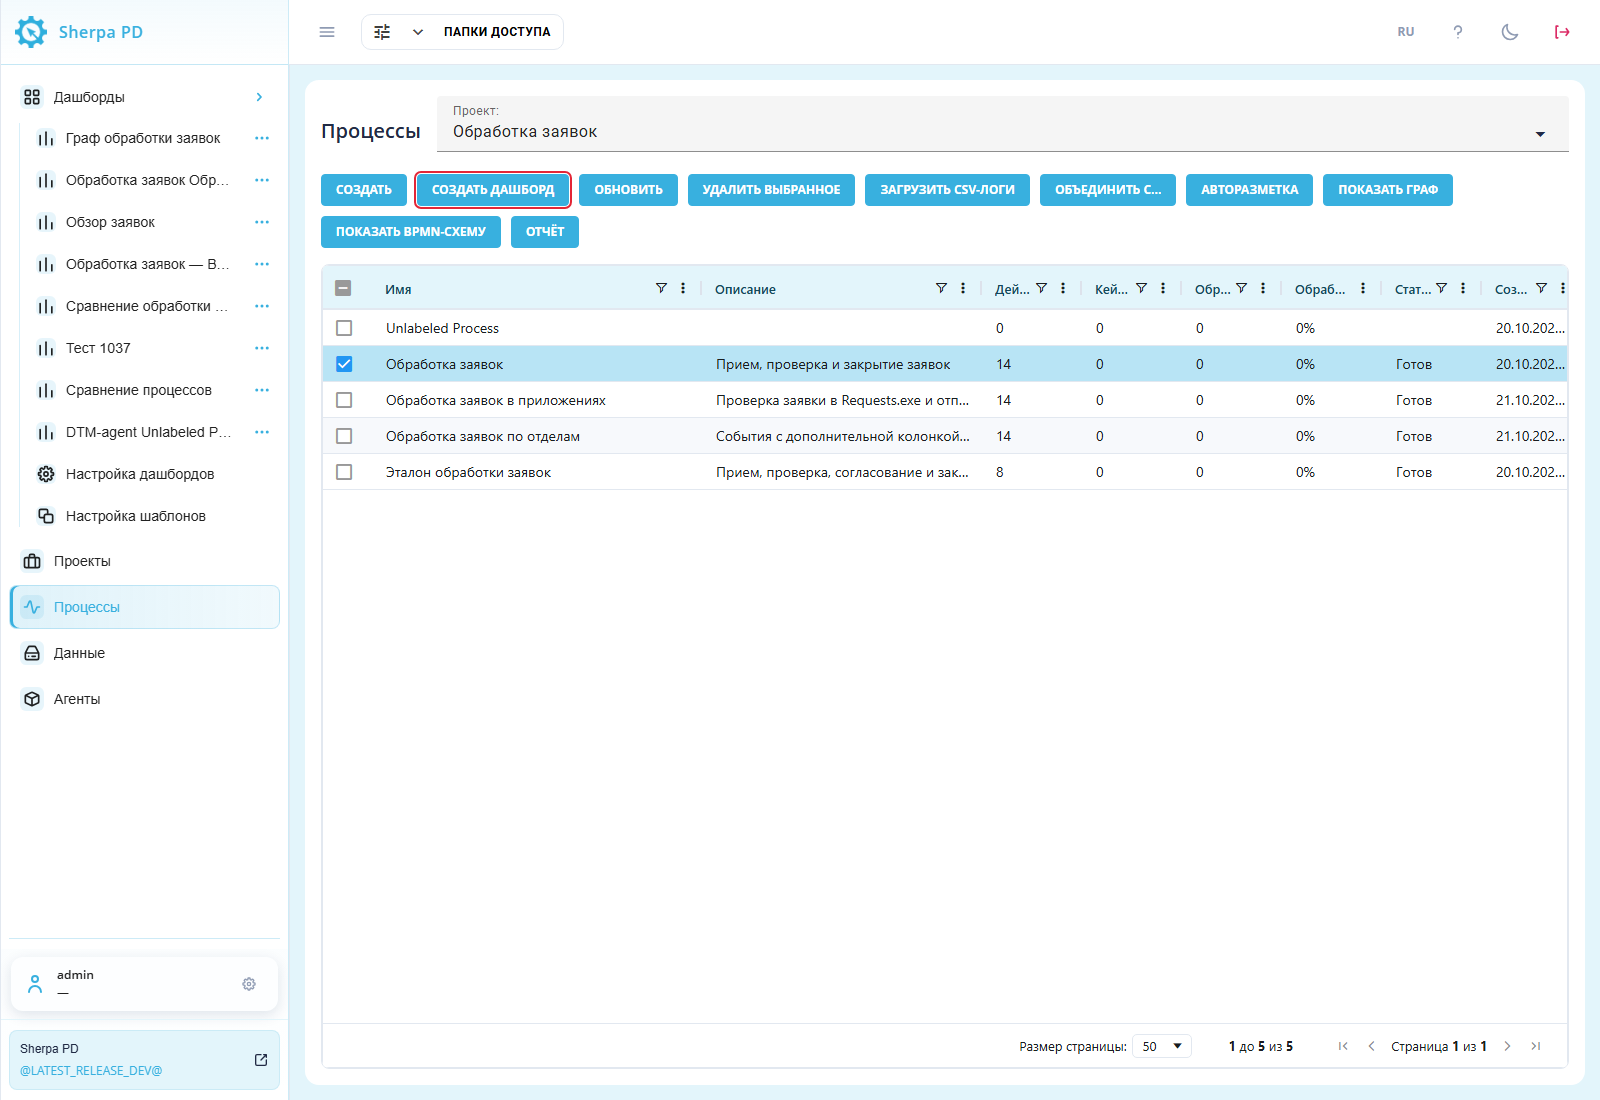
"Processes" screen: selected process and "Create Dashboard".
The popup shows the process name and the required "Select template*" field. Choose a template and click "OK" to create the panel. "Cancel" cancels the action.
Example: Базовый дашборд (пример) is selected in "Select template*" for Обработка заявок. In the created dashboard, the process filter will use Обработка заявок as its selected value.

"Create Dashboard" popup window: selecting a process template.
5. Managing Templates#
Templates reuse an effective widget set when creating other panels.
Select one dashboard in the registry and click "Create template from…" to preserve its widget set.
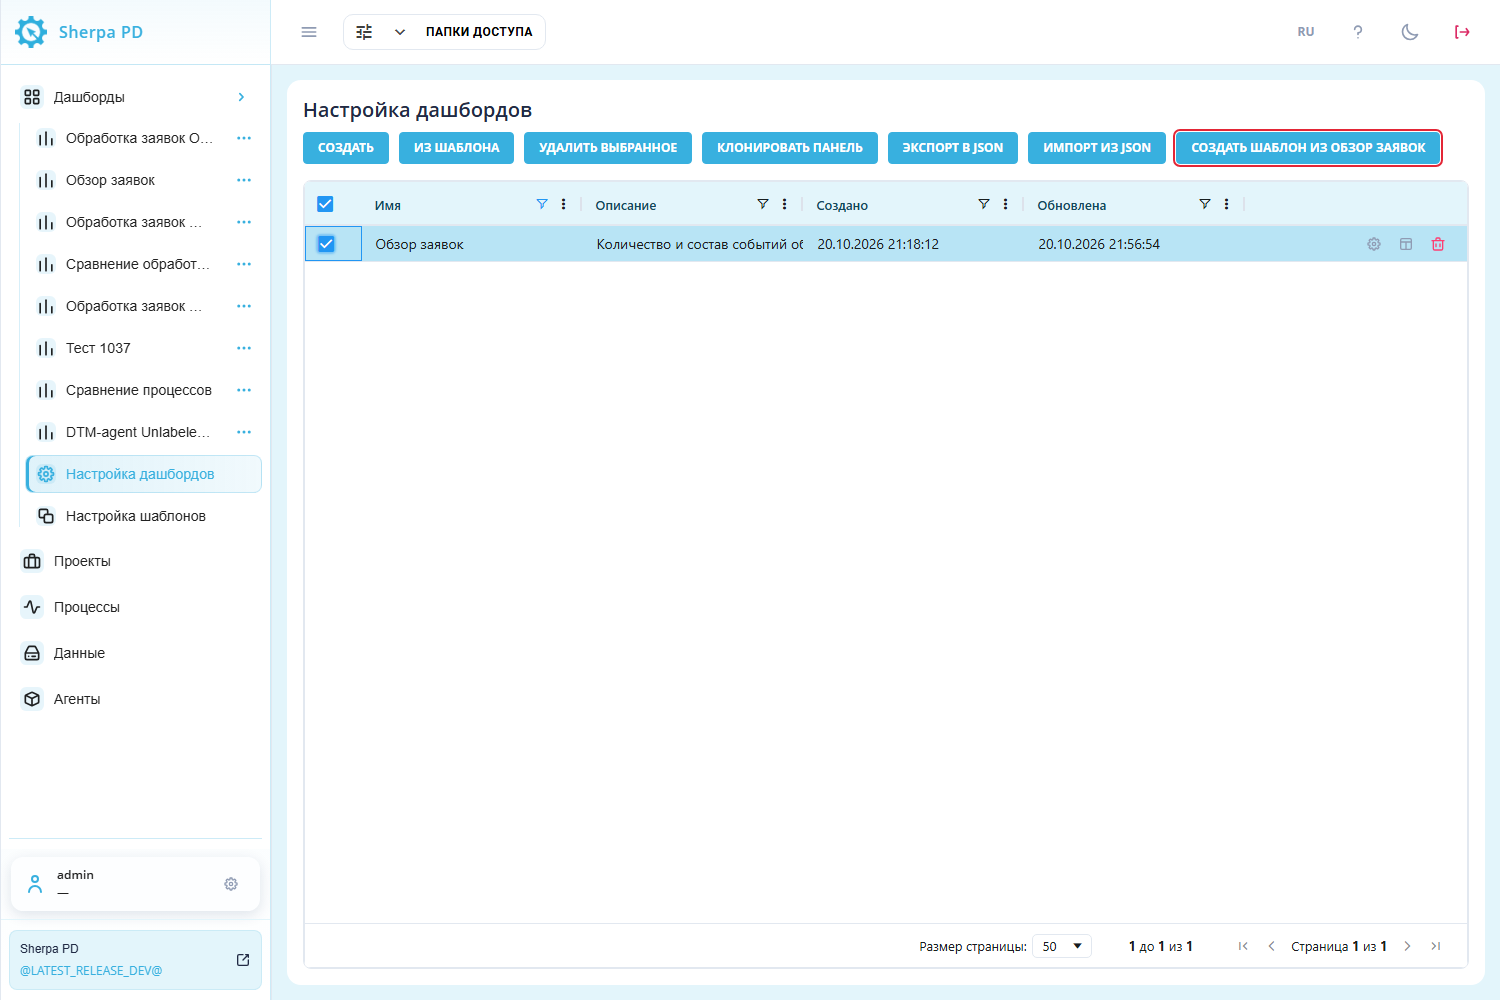
"Customize Dashboards" screen: selected panel and "Create template from…".
The original panel stays listed. The new template appears in "Customize Templates", where its name and description can be changed, its widgets edited, or the template deleted. This screen also supports creating empty templates and JSON exchange.
Example: a template was created from Обзор заявок and renamed Шаблон обработки заявок, with description События заявок, счетчик и лимит строк.
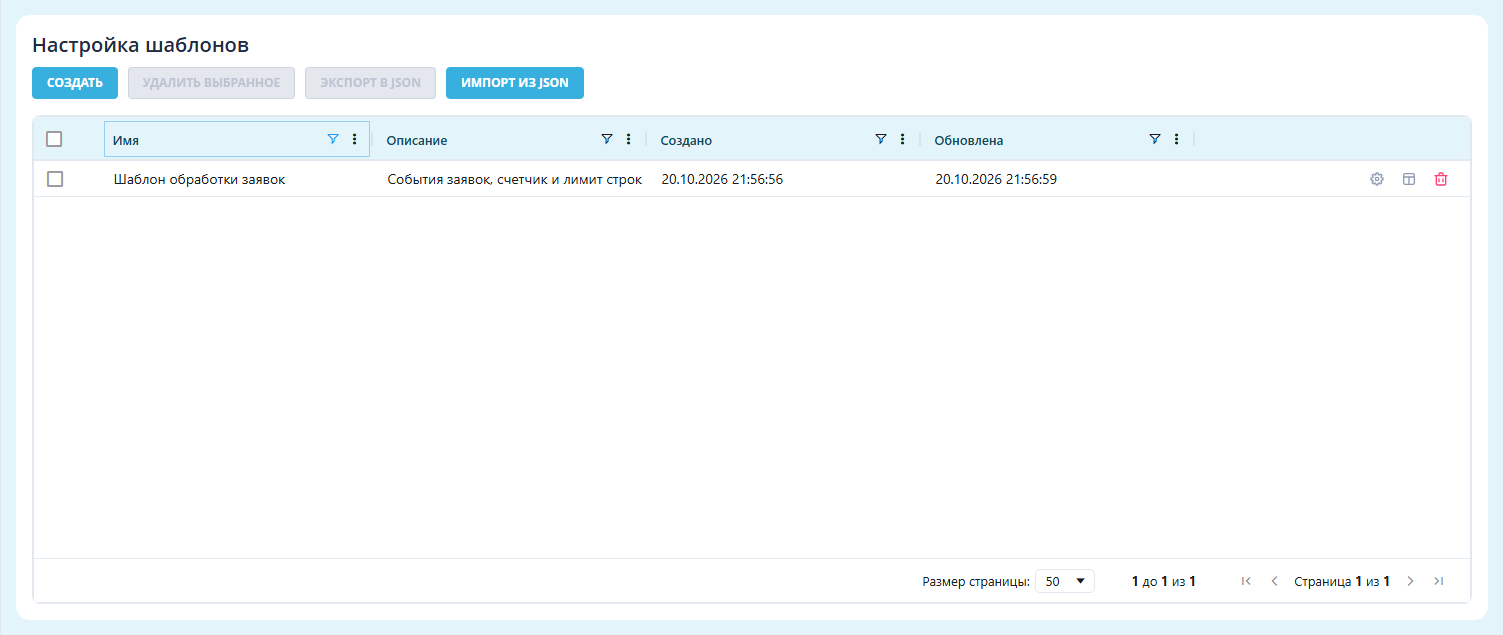
"Customize Templates" screen: user template.
6. Dashboard Designer#
The Dashboard Designer adds widgets and changes their positions and sizes.
"Form Designer" button#
"Form Designer" in a registry row opens the Dashboard Designer.
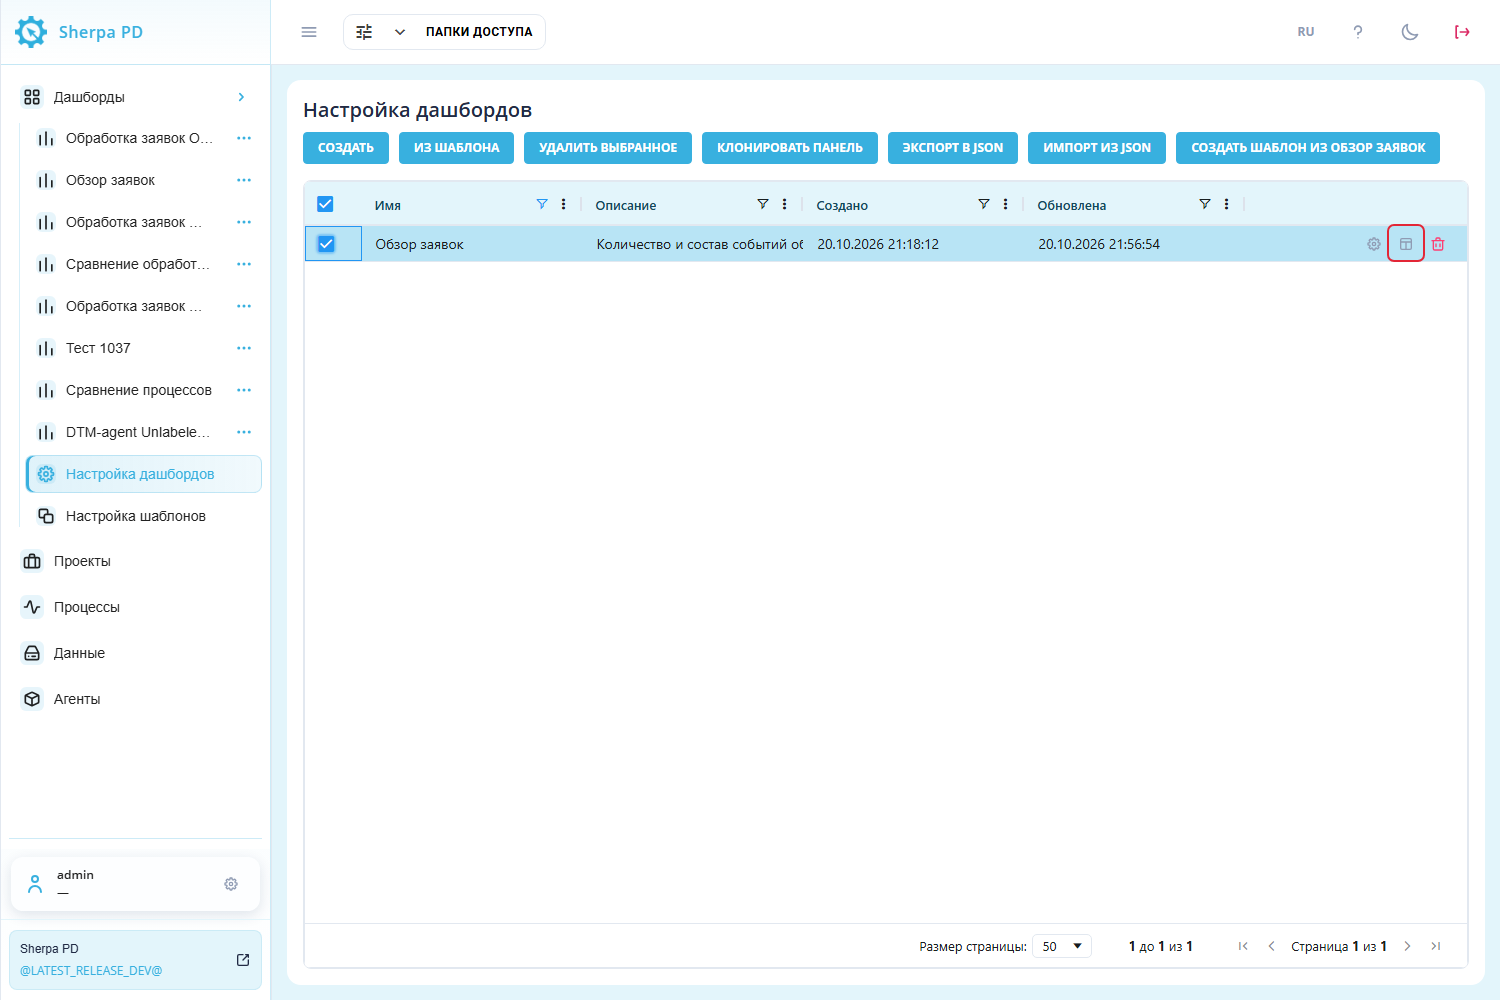
"Customize Dashboards" screen: "Form Designer" in the dashboard row.
Alternatively, click "Dashboard actions"  beside the panel name in the left menu and select "Form Designer".
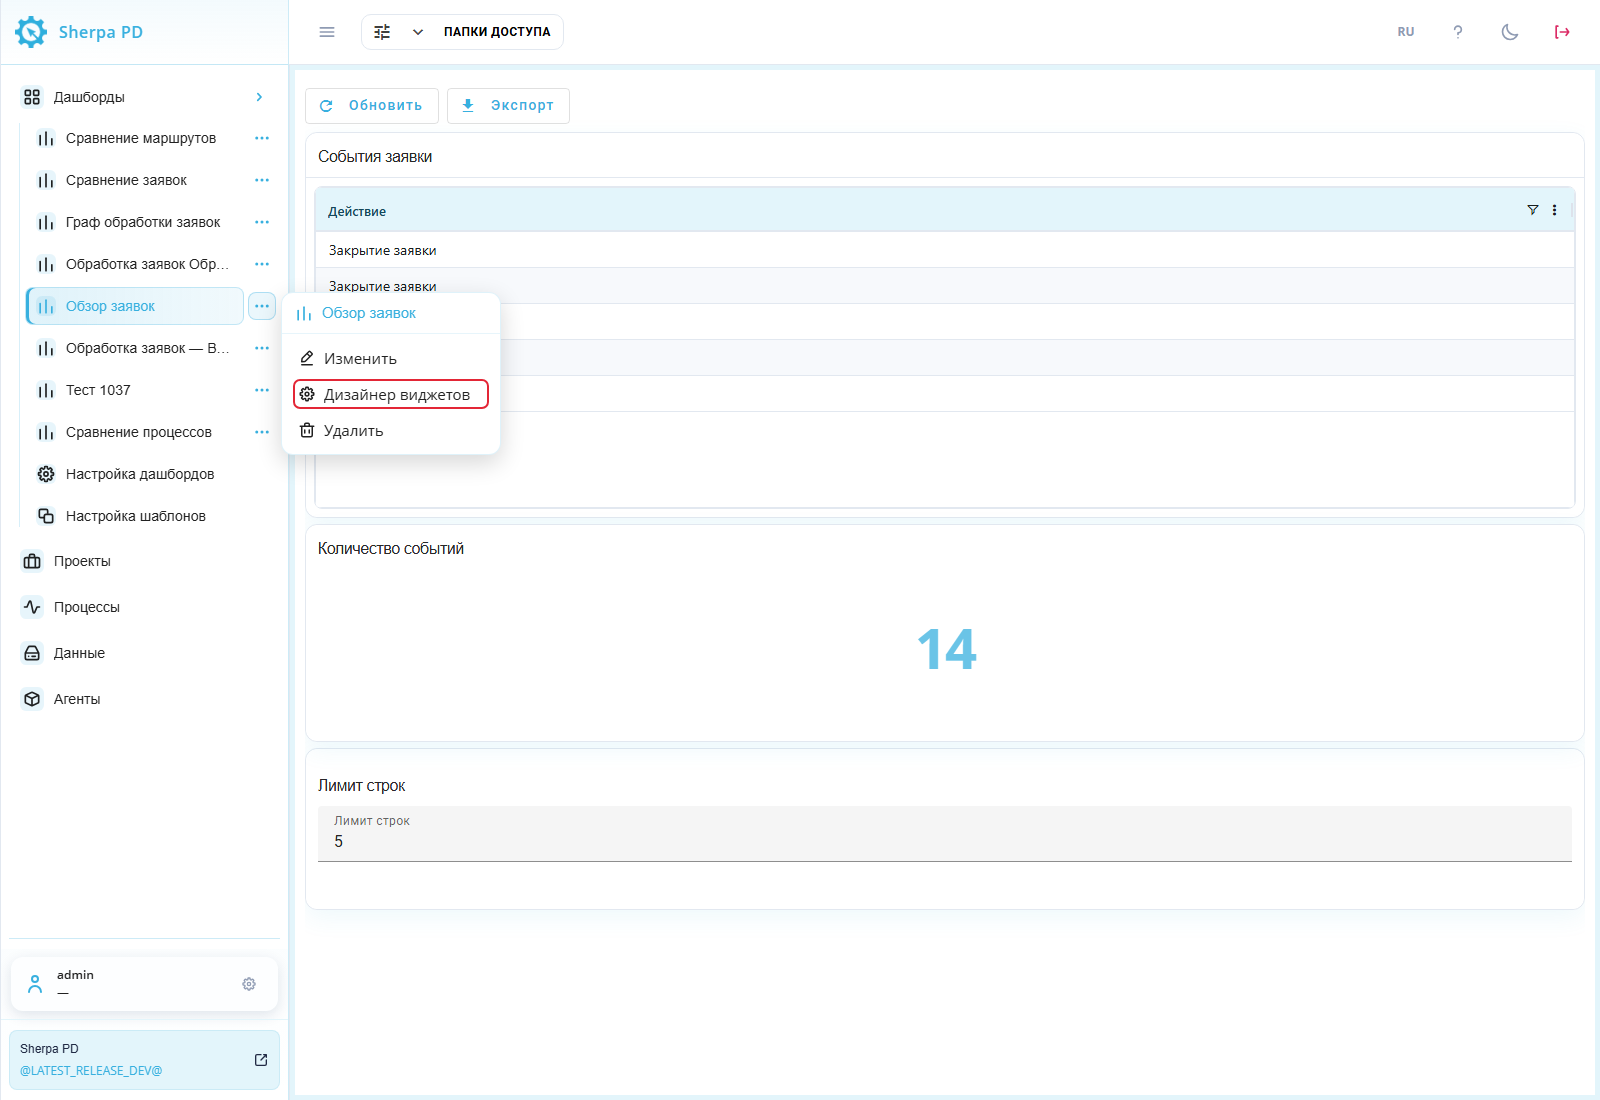
Left "Dashboards" menu: "Form Designer" in the panel actions menu.
Drag widgets using their move handle and resize them from the bottom-right corner. Layout and sizes save after changes. Widget controls copy, configure, and delete  a widget.
In the Dashboard Designer, click the widget edit button  to open "Widget settings". For tables and charts, this popup contains the widget query builder, which lets you choose the data source, joins, and filter conditions for that widget. The "Constructor" button enables visual query preparation, while "Advanced mode" enables manual SQL entry. Graphs, BPMN, variable filters, and other special widgets have their own settings.
Example: the panel contains the События заявки table, Количество событий number widget, and Лимит строк filter with value 5. The Dashboard Designer shows all three and its composition controls.
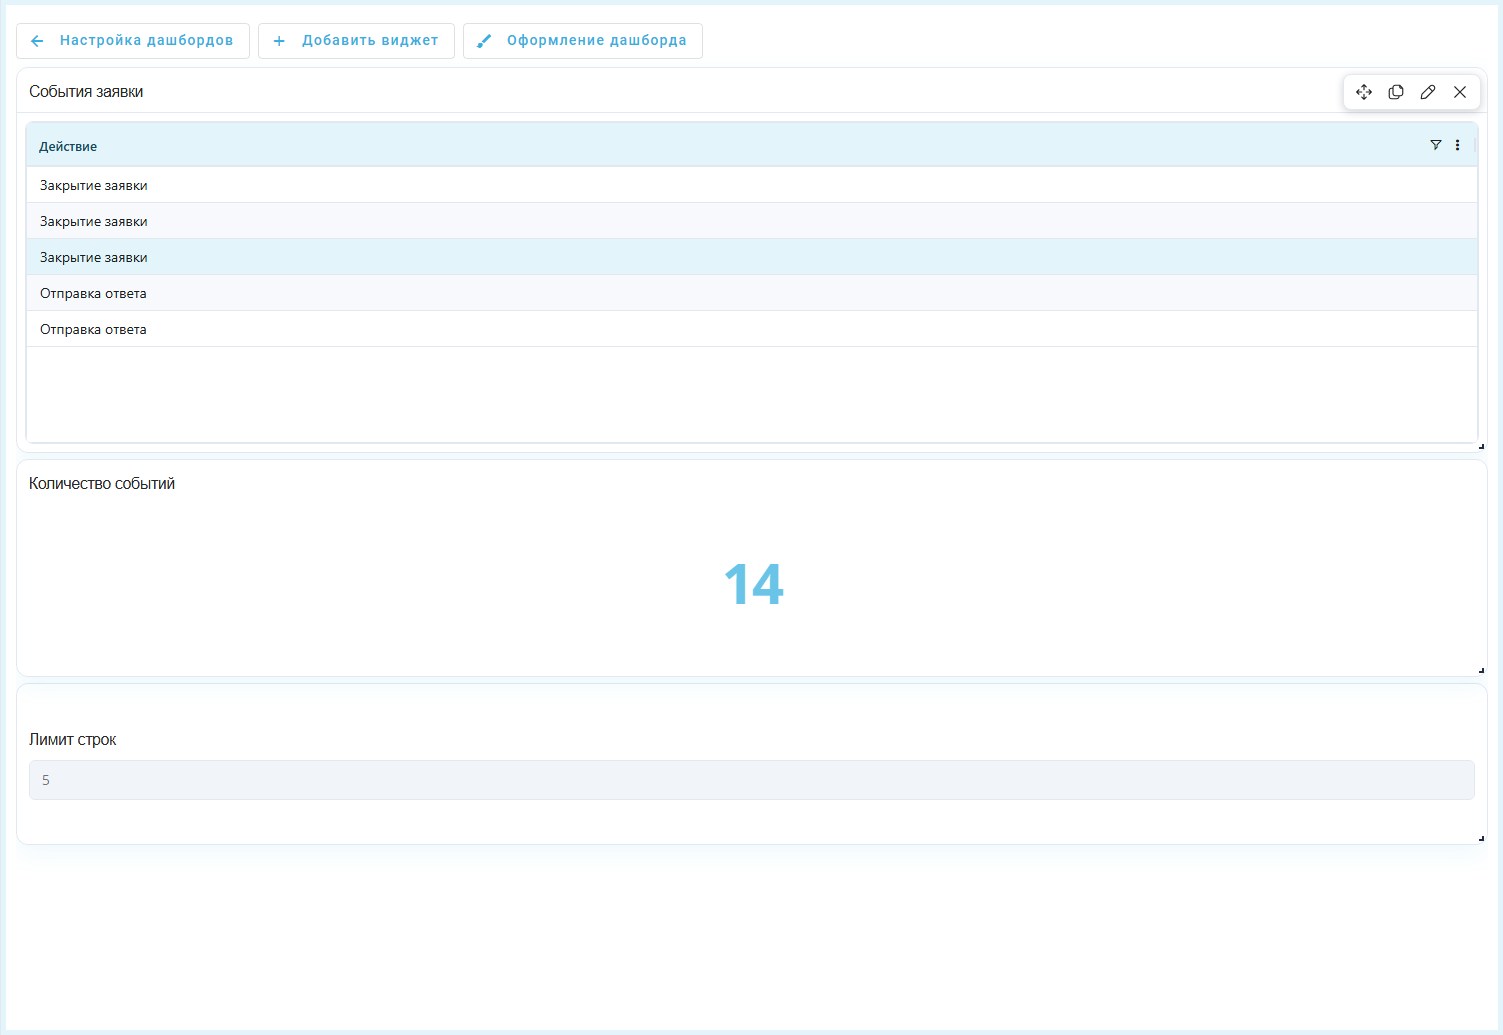
Dashboard Designer: table, number widget, and variable filter.
Adding a Widget#
Adding a widget extends the panel with another data view.
"Add widget" button#
The "Add widget" button opens a dialog with widget type tiles. Select a tile and click "Add". The following widget types are available:
- "Bar chart" — compares values across categories, such as event counts by action;
- "Timeline" — shows event order and duration on a time axis;
- "Timeline by days" — arranges time intervals by day to compare activity across dates;
- "Line chart" — shows how a metric changes over time;
- "Number" — displays one total, such as the event count;
- "Pie chart" — shows each category's share of the total;
- "Box plot" — shows the distribution of numerical values by category, including the box, whiskers and outliers;
- "Sankey diagram" — shows flows and transitions between data groups;
- "Bubble chart" — compares items through bubble position and size;
- "Table" — shows source records and calculated values as rows;
- "Variable filter" — supplies a selected value to other widgets for filtering;
- "Comment" — adds plain explanatory text to the panel without markup;
- "Text" — adds a formatted block to the panel using Markdown;
- "BPMN schema" — shows a work sequence in BPMN notation;
- "Process graph" — shows process actions and transitions between them;
- "Process cost analytics" — supports analysis of work time and cost by process or employee;
- "Data quality" — shows error metrics for checking source event quality;
- "Pivot table" — groups data by rows and columns and shows aggregate metrics at their intersections;
- "Area chart" — shows a metric with a filled area below the line;
- "Funnel" — compares values at successive stages to reveal drop-offs;
- "Percentage KPI" — shows a numerator-to-denominator ratio on a circular scale;
- "Gauge" — shows a value against a specified maximum on a semicircular scale;
- "Image" — adds an image to the dashboard;
- "Container" — groups several widgets into tabs within one cell.
Example: to display process events, select the "Table" tile and click "Add". The new widget appears in the Dashboard Designer.

"Add widget" dialog with the "Table" tile selected
"Text" widget#
The widget displays headings, lists, links, and other elements defined with Markdown. It does not load data from the database.
In the Dashboard Designer, click "Add widget" and select the "Text" type.
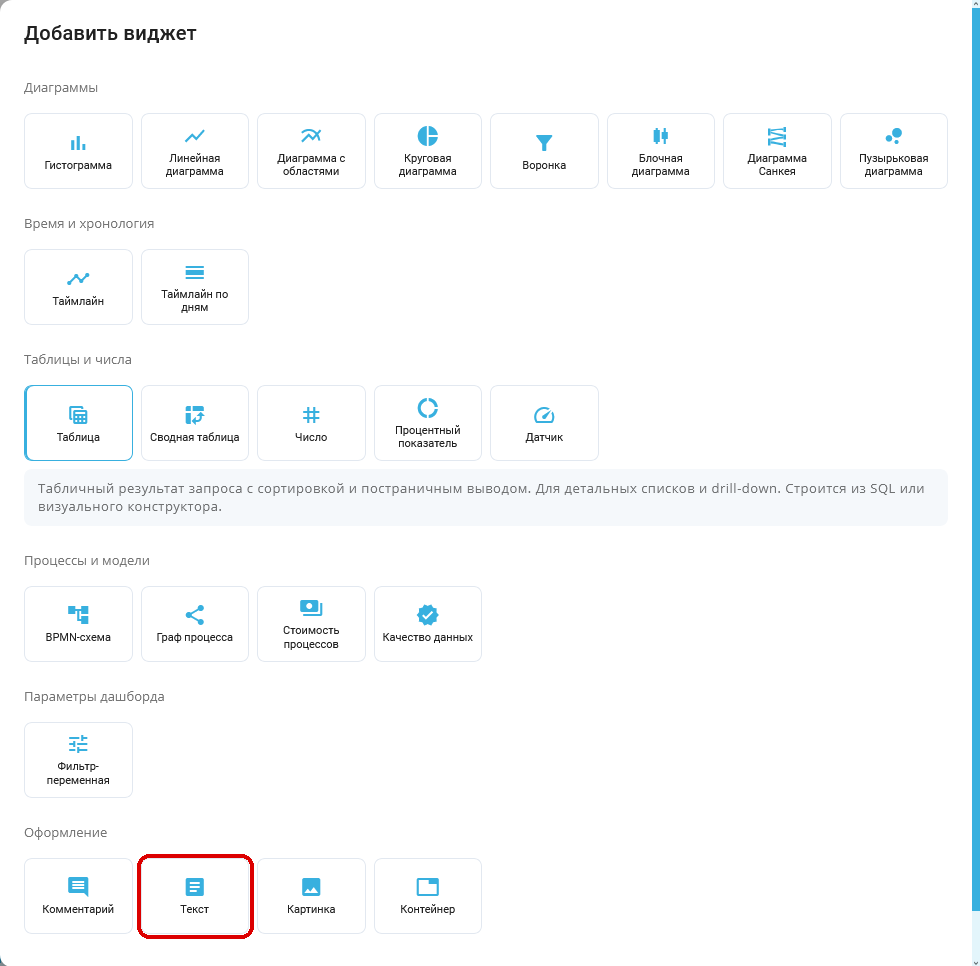
"Add widget" popup window: Text tile outlined in red. Russian interface.
Then open widget settings with the edit button .
The "Widget settings" dialog contains the following controls.
Required fields:
- "Widget name*" field — the block title on the panel.
Additional fields:
- "Text (Markdown)" field — the content to display.
The "Preview" block shows the formatted result and is not filled in manually.
Example: to show a short processing summary, enter the widget name Итоги обработки, paste the text below into "Text (Markdown)", and click "Save". The panel displays a heading, list, and link.
## Краткий итог
- Среднее время обработки — **2,5 ч**
- Подробнее — [инструкция по дашбордам](https://docs.sherparpa.ru/sherpa-process-discovery/rabota-v-sherpa-process-discovery/ekrany/dashbordy)
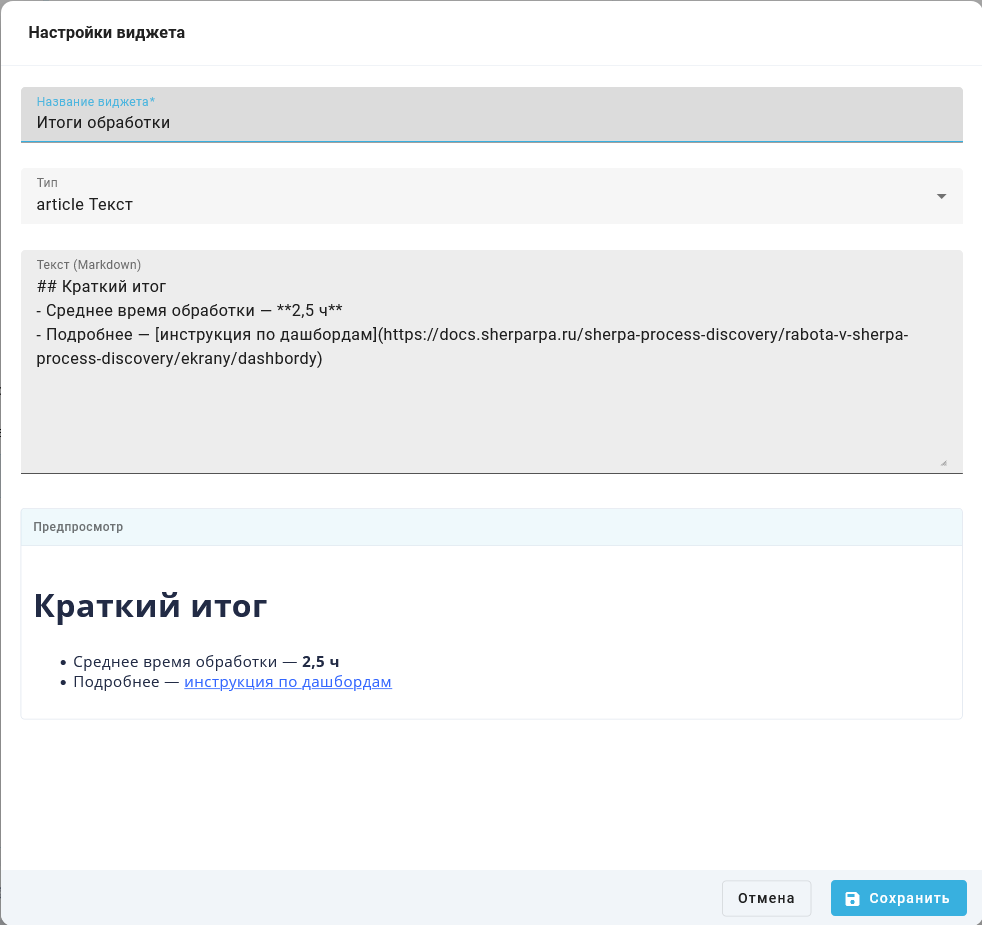
Widget settings with the Markdown text field and preview
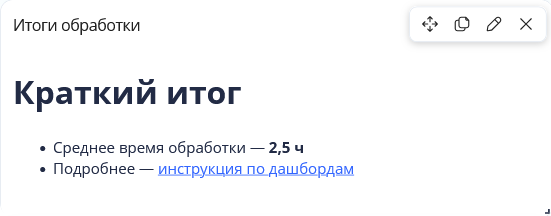
Rendered text widget with a heading, list, and link
"Save" applies the settings. "Cancel" closes the dialog without changes.
The "Comment" widget still stores plain text in "Comment text" and does not apply Markdown. Use "Text" when you need formatted explanations.
Arbitrary HTML and scripts are not supported: only safe markup elements are shown.
Container widget#
A container groups several widgets into tabs within one dashboard grid cell. It lets users switch data views while saving panel space.
In the Dashboard Designer, click "Add widget", choose "Container", and click "Add".
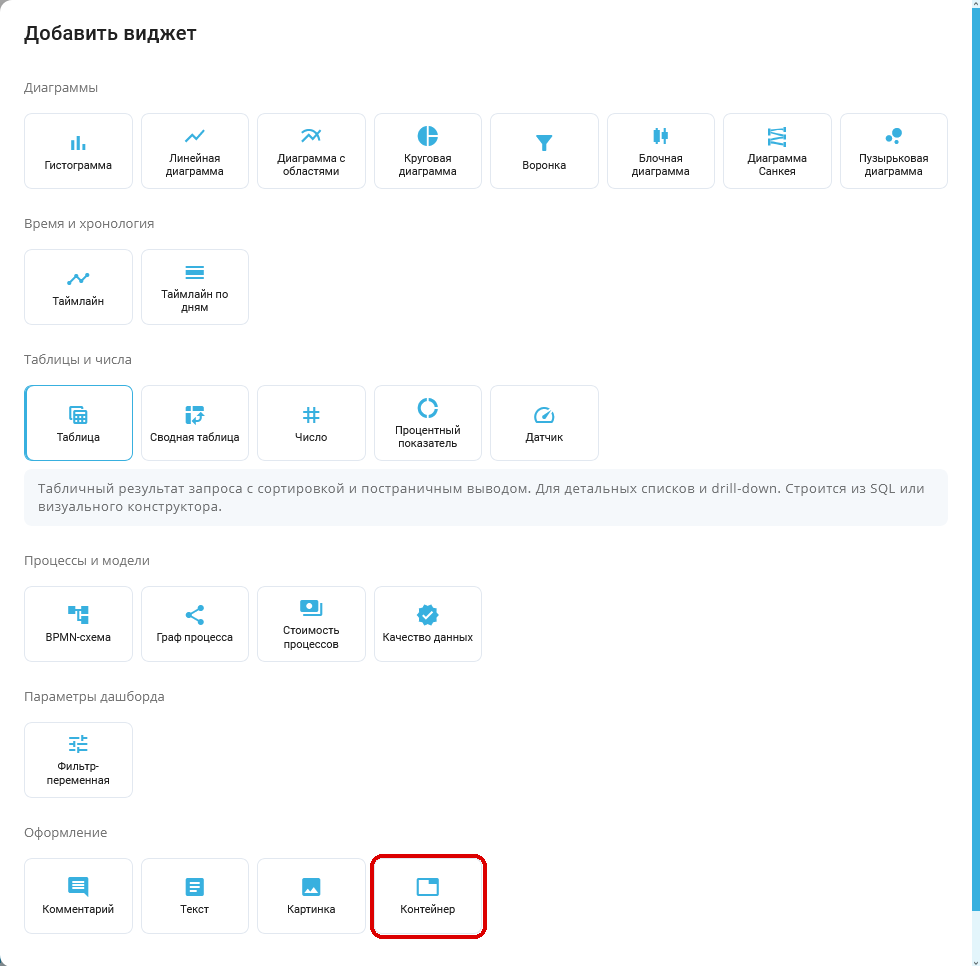
"Add widget" popup window: Container tile outlined in red. Russian interface.
Open the added container's settings with its edit button .
The "Widget settings" popup window contains one required field:
Required controls:
- "Widget name*" field — sets the container's name.
Additional controls:
This widget type has no additional fields. "Save" saves the container. The button for adding a tab is unavailable until the container is saved.
Example: enter Пояснения in "Widget name*" and click "Save".
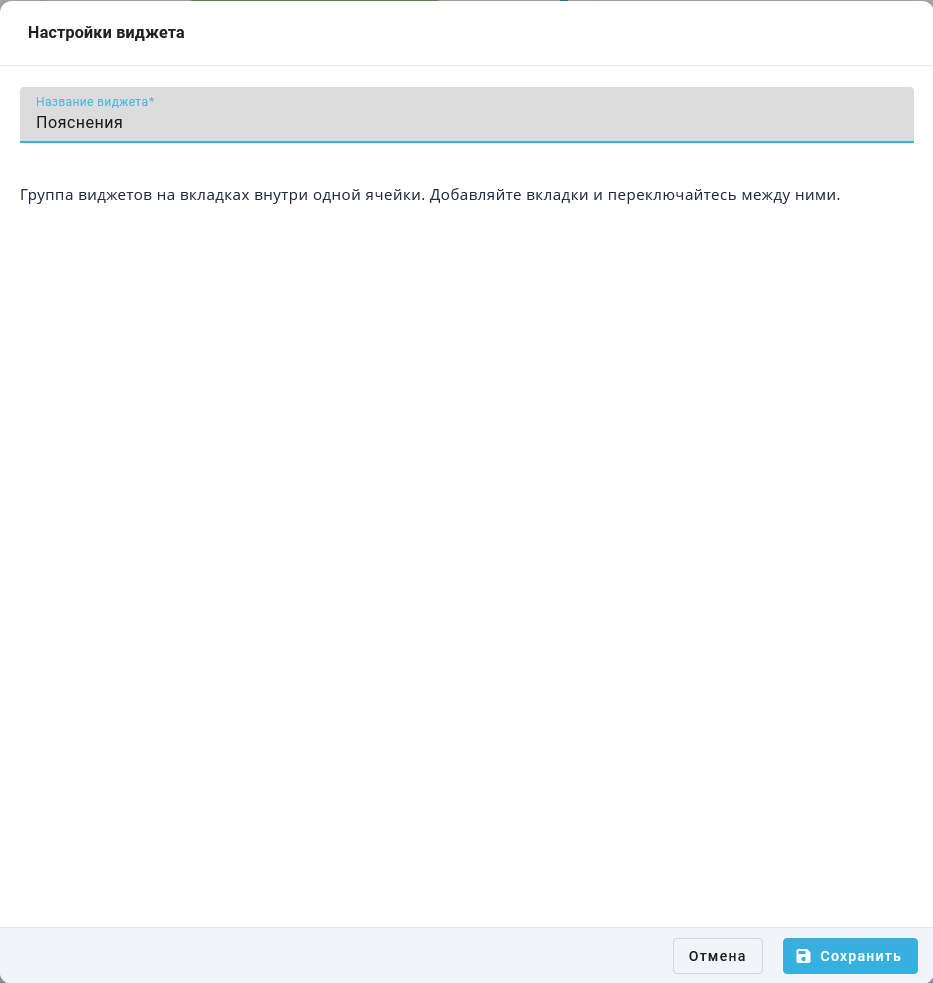
"Widget settings" popup window: container named Пояснения. Russian interface.
After saving, the empty container shows "No tabs yet". Its tab widgets do not occupy separate grid cells.
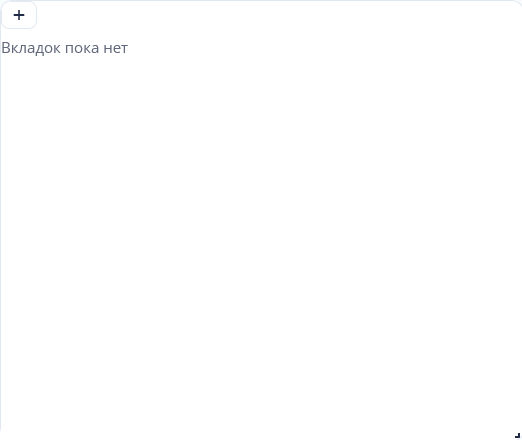
Container Пояснения: empty state and button for adding a tab. Russian interface.
Button for adding a tab#
The button in the tab row  adds another data view to a saved container. It opens the "Add widget" popup window. To add an explanation, choose "Comment" and click "Add".
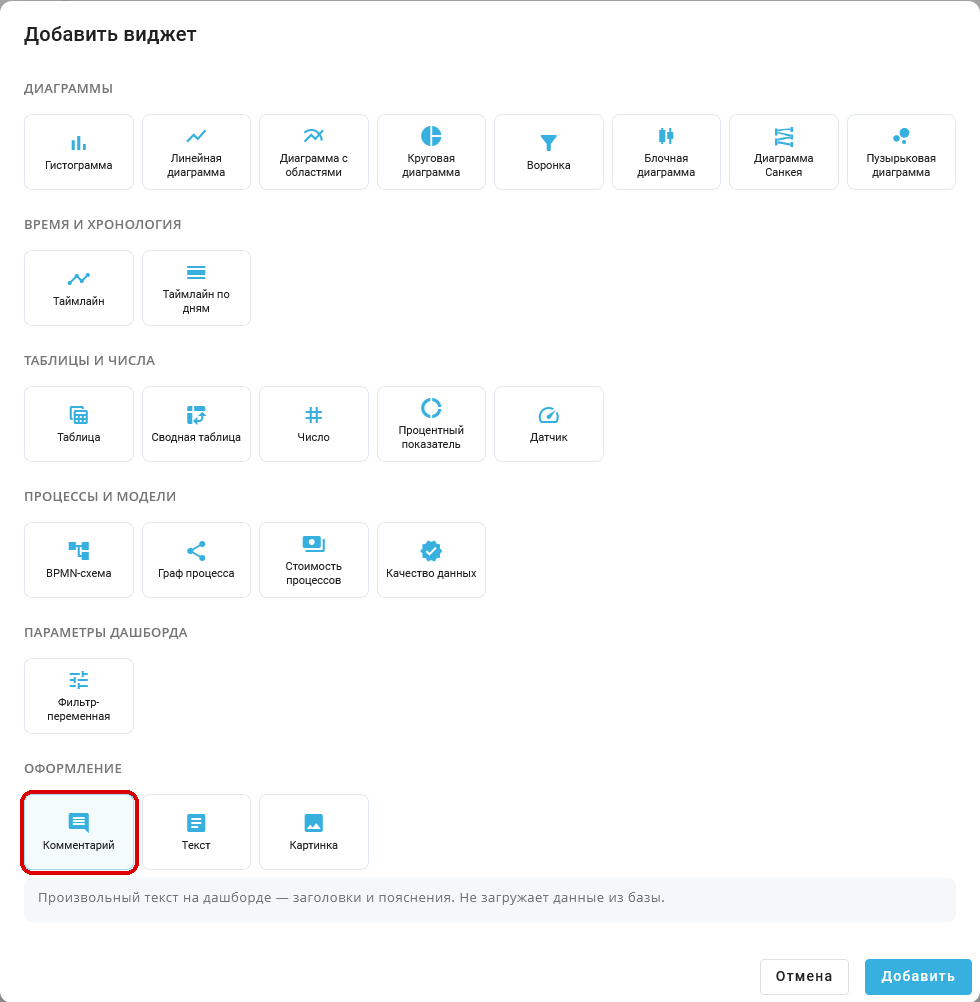
"Add widget" popup window: Comment selected, no Container tile. Russian interface.
"Container" is absent from this picker because nested containers are not supported.
For "Image", "Comment", "Text", "BPMN schema", "Process graph", "Process cost analytics", and "Data quality", settings open after selection. Save them to create the tab.
For "Comment", the "Widget settings" popup window contains these controls:
Required controls:
- "Widget name*" field — sets the tab name in the container.
- "Type" list — selects the tab content. Leave "Comment" selected for a text explanation.
Additional controls:
- "Comment text" field — sets the explanation inside the tab. If empty, the tab has no comment text.
"Save" creates the tab. "Cancel" closes settings without creating it.
Example: enter Назначение панели in "Widget name*", leaving "Comment" selected in "Type". Enter Панель показывает учебные примеры обработки заявок. in "Comment text" and click "Save".
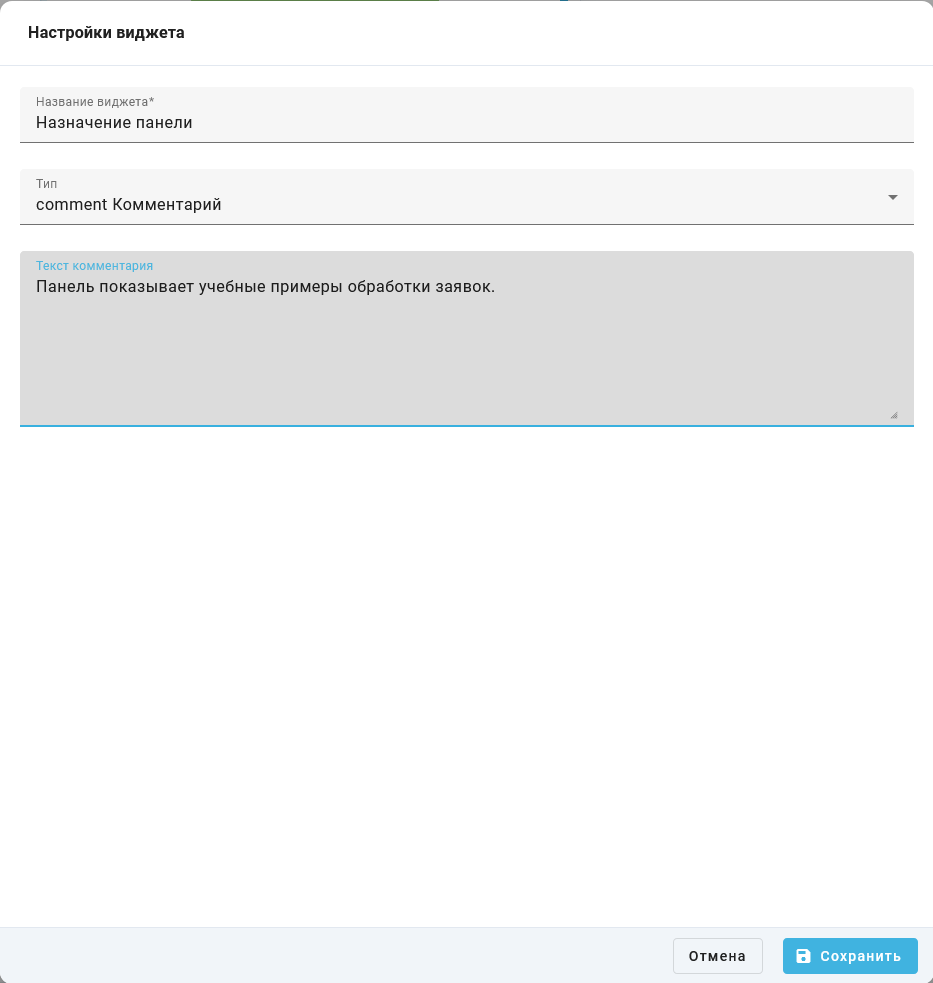
"Widget settings" popup window: tab name and comment text. Russian interface.
Container tabs#
Tabs let users choose a widget without opening another dashboard. Click a tab name at the top of the container to switch to it. In the Dashboard Designer, the buttons below the tab row move 
 , edit
 , or remove
 the selected tab. Moving left is unavailable for the first tab, and moving right is unavailable for the last tab. View mode shows tab selectors without content management buttons.
Example: the Назначение панели tab is selected in the Пояснения container. Its explanation appears below the tab controls.
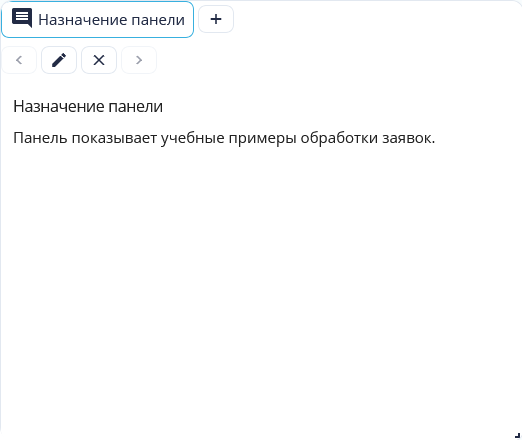
Container: selected comment tab and its content. Russian interface.
Cloning a dashboard, creating a dashboard from a template, and transferring it through YAML preserve the container and its tabs. Deleting a container also deletes all its child widgets.
"Funnel" widget#
The widget compares values at consecutive Process stages and helps identify the largest losses between steps. Stages appear from top to bottom in the order of the source data.
In the Dashboard Designer, click "Add widget", select the "Funnel" tile in the "Charts" group, then click "Add".

"Add widget" pop-up window: the location of the "Funnel" tile is outlined in red. Russian interface
To configure the added widget, click the edit button .
The following elements in the "Widget settings" pop-up window are used for the tutorial funnel.
Required elements:
- The "Widget name*" field in the "Basic" step — sets the funnel title on the dashboard.
- The "Type" list in the "Basic" step — determines the chart type. Select "Funnel" for this configuration.
- The "SQL" field in the step of the same name — specifies the query in "Advanced mode". In this example, the query returns stage names in the
namecolumn and their values in thecountcolumn.
Optional elements:
- The "Preview" block — shows a preview of the chart. The "Demo data" label means that the interface displays sample values rather than the result of the entered SQL. This block is not filled in manually.
- The "Example Requests" block — contains sample SQL queries for configuring the widget. They are not needed for the example that follows.
In the widget query builder, the "Constructor" and "Advanced mode" buttons in the window header switch the method of preparing data. In "Constructor" mode, specify one or more slices for stages and measures for values. To enter a query manually, select "Advanced mode", then the "SQL" step. A query with constant values does not require selecting a table in the "Tables" step.
Example: to compare request processing stages, select "Advanced mode". In the "Basic" step, enter Обработка заявок in the "Widget name*" field and select "Funnel" in the "Type" list.
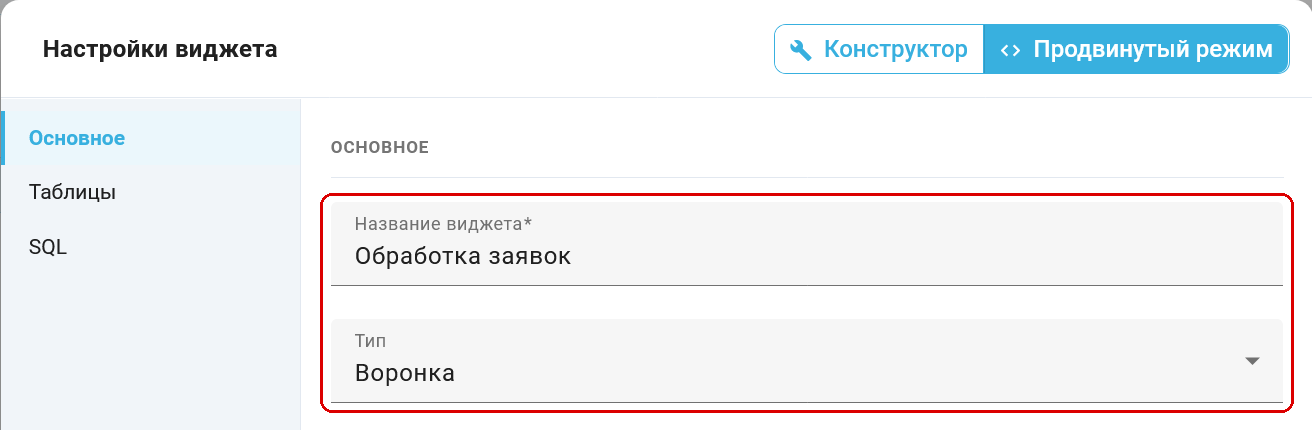
"Basic" step: widget name Обработка заявок and type "Funnel". Russian interface
Open the "SQL" step and enter the following query. It defines the numbers 100, 72 and 50 without reading the event log. Keep the Russian stage names exactly as written to reproduce the screenshots.
SELECT 'Получено' AS name, 100 AS count, 1 AS stage
UNION ALL SELECT 'Проверено', 72, 2
UNION ALL SELECT 'Завершено', 50, 3
ORDER BY stage
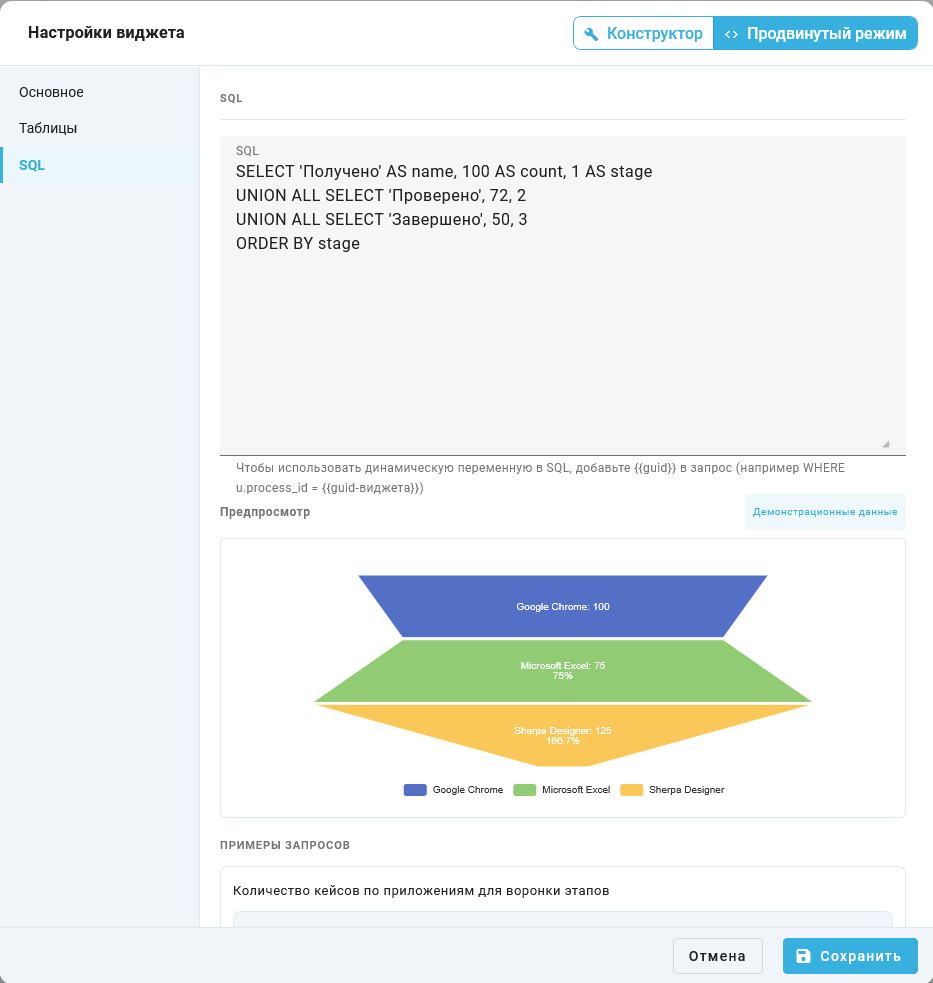
"SQL" step: the query for stages 100, 72 and 50. The "Preview" block displays demo data. Russian interface
Click "Save". In the Dashboard Designer, the Обработка заявок funnel shows the stages Получено — 100, Проверено — 72 and Завершено — 50. Conversion from the preceding stage is 72 % and 69.4 %. The value of the last stage is 50 % of the first.
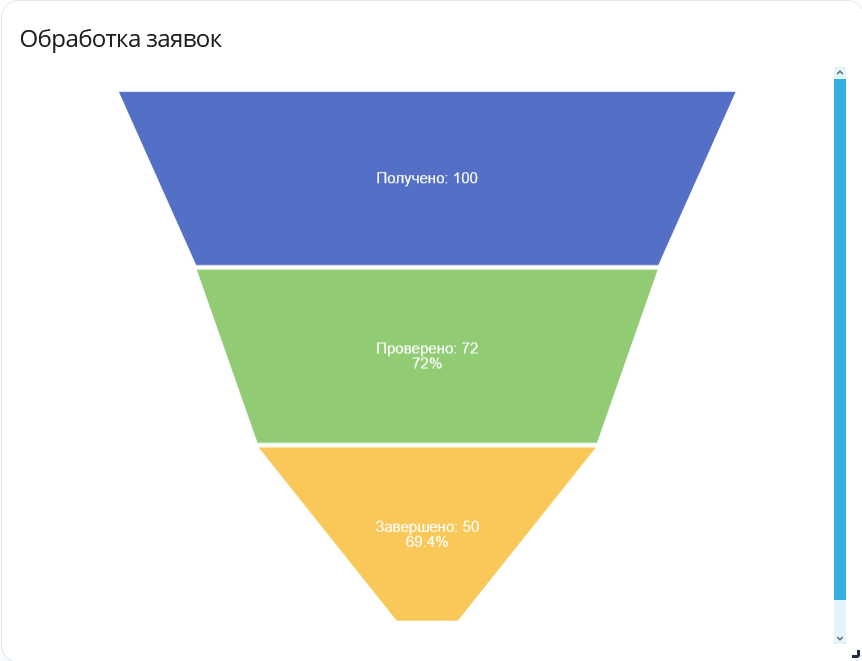
Saved funnel Обработка заявок: 100 → 72 → 50, conversion 72 % and 69.4 %. Russian interface
Hover over the Завершено stage to see its value of 50, conversion from the preceding stage of 69.4 %, and share of the first stage of 50 %.
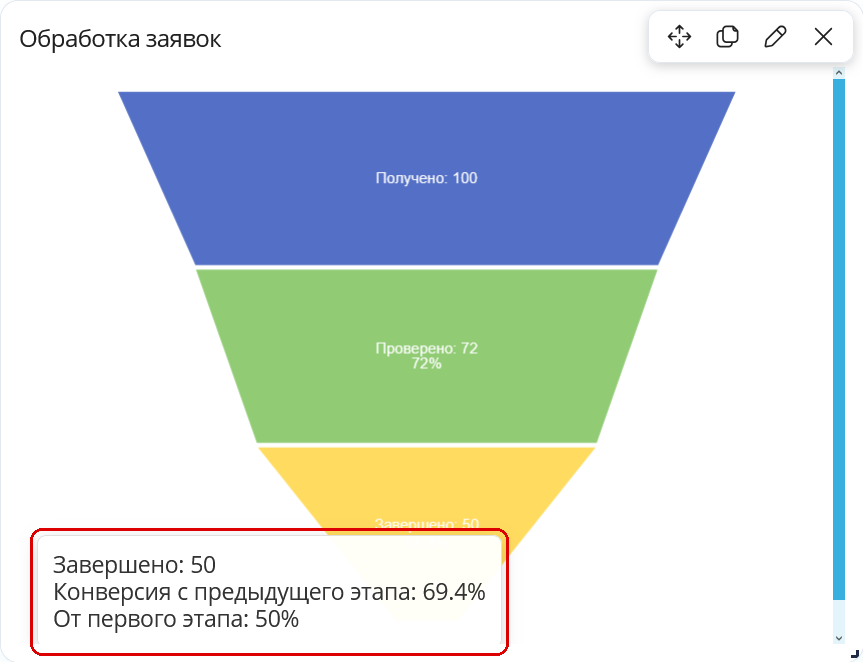
Tooltip for the Завершено stage: 50, conversion 69.4 %, and share of the first stage 50 %. Russian interface
The stage order is determined by SQL ORDER BY or the order of the widget query builder result. The funnel does not reorder stages by value.
The "Cancel" button closes the "Widget settings" pop-up window without saving changes.
"Percentage KPI" widget#
The widget helps assess how much of a target the current value represents. It displays the numerator-to-denominator ratio as a percentage on a circular scale starting at the top.
In the Dashboard Builder, click the "Add Widget" button, choose the "Percentage KPI" tile in the "Tables and numbers" group, and click "Add".
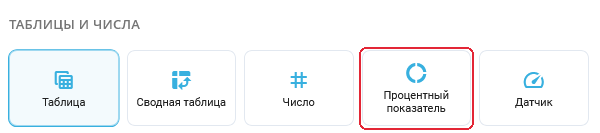
"Add Widget" dialog: the "Percentage KPI" tile in the "Tables and numbers" group
The "Widget Settings" dialog opens. To change a saved indicator, use the edit button on its card. The "Basic" step contains:
Required fields:
- "Widget Name*" field — the required indicator label on the dashboard. For this example, enter
Доля выполненных.
Additional fields and settings:
- "Type" list — contains "Percentage KPI" after the tile is selected.
- "Numerator" group — sets the value whose share is calculated. The default is "Constant" with a value of
0. - "Denominator (of what)" group — sets the reference value. The default is "Constant" with a value of
100.
Choose the value source independently in each group:
- "Constant" button — opens the "Number" numeric field. Enter a fixed value. This method is useful for checking the calculation and setting a constant reference.
- "Variable" button — opens the "Filter variable" list. Select a variable-filter widget on the same dashboard that returns a number. A nonnumeric string or an empty value produces
0. - "Computed" button — opens the "Constructor measure" list. Configure a measure on the "Results" step of the widget query builder, then return to "Basic" and select its name. For an overall total, the query must return a single aggregate without slice grouping. If several values are returned, the first is used rather than the sum of the rows.
The "Tables", "Joins", "Filters", and "Results" steps appear when "Computed" is selected in at least one group. Constants and variables only need the "Basic" step. This widget does not display the "Advanced Mode" switch: the numerator and denominator sources are selected separately. See the widget query builder instructions for configuring measures.
Example: for the completion rate, select "Constant" in the "Numerator" group and enter 72 in "Number". In the "Denominator (of what)" group, select "Constant" and enter 100 in "Number".
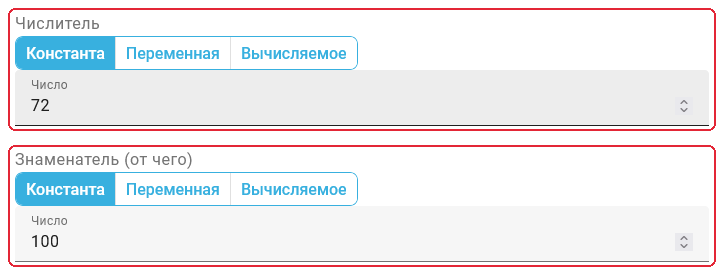
"Widget Settings" dialog, "Basic" step: numerator 72 and denominator 100
After clicking "Save", the Доля выполненных widget displays 72 %. "Cancel" closes settings without applying changes.
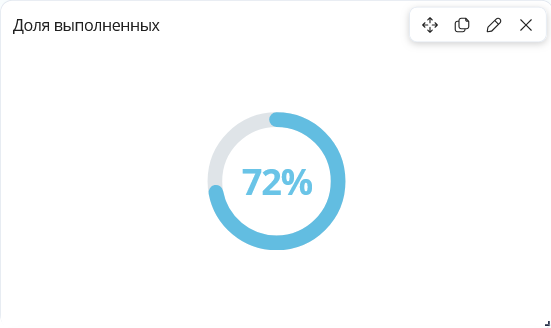
"Доля выполненных" widget: result 72 %
The result is numerator / denominator × 100, rounded to one decimal place. A zero denominator produces 0 %. Negative values retain their sign. The scale fills according to the result's absolute value, up to 100 %. An ellipsis appears beside the number when its absolute value exceeds 100 %. For example, 150 relative to 100 produces 150 % with a full scale and an ellipsis.
"Gauge" widget#
The gauge compares a current indicator with a planned value or limit. The needle position and semicircle fill depend on the indicator-to-maximum ratio. The indicator itself appears below the scale, and the maximum is shown under the right end of the arc.
To add a gauge in the Dashboard Builder, click "Add Widget", select the "Gauge" tile in "Tables and numbers", and click "Add".
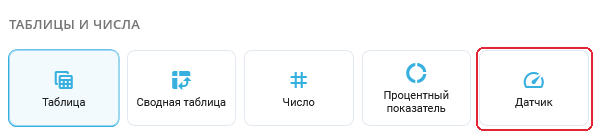
"Add Widget" dialog: "Gauge" tile in "Tables and numbers"
Configure a new gauge in the "Widget Settings" dialog. For a saved gauge, the edit button on its card opens these settings. The "Basic" step includes the following fields and controls.
Required fields:
- "Widget name*" field — sets the gauge label on the dashboard. The example uses
Выполнение плана.
Additional fields and settings:
- "Type" list — is set to "Gauge" after adding the selected tile.
- "Value" group — defines the current indicator. A new gauge starts with the constant
0. - "Maximum (range)" group — defines the scale's upper bound. Its initial constant is
100. Use a positive bound for a normal proportion display.
Each group has its own value-source buttons:
- "Constant" button — accepts a fixed value in the "Number" numeric field. Use it when the indicator or its maximum does not depend on Process data.
- "Variable" button — displays the "Filter variable" list for choosing a numeric filter on this dashboard. An empty or nonnumeric selection supplies
0to the calculation. - "Computed" button — selects an indicator from "Constructor measure". First create the measure on the "Results" step of the widget query builder, then select its name on "Basic". An overall total needs an aggregate without slice grouping. Multiple result rows are not automatically added together: the gauge uses the selected measure's first value.
Selecting "Computed" for either group makes "Tables", "Joins", "Filters", and "Results" available. With each group set to "Constant" or "Variable", only "Basic" is needed. The gauge hides the general "Advanced Mode" switch because its value and maximum are configured separately. See the widget query builder section for preparing the query.
Example: for the Выполнение плана gauge, select "Constant" in "Value" and enter 72 in "Number". In "Maximum (range)", select "Constant" and enter 100 in "Number".
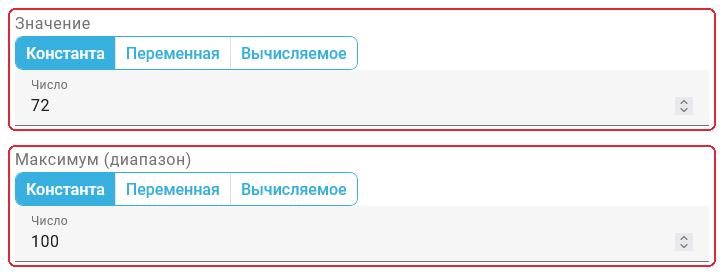
"Widget Settings" dialog, "Basic" step: value 72 and maximum 100
After clicking "Save", the gauge card displays 72 with a maximum of 100. The arc is 72 % filled, and the needle indicates the same proportion. Use "Cancel" to leave settings without applying the changes.
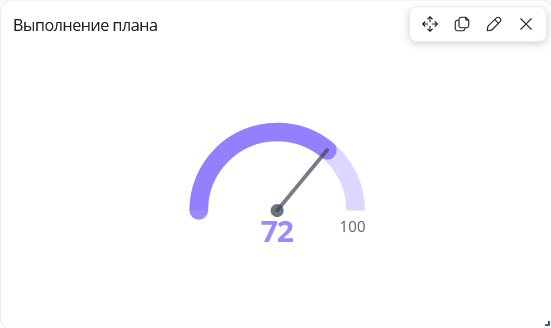
"Выполнение плана" widget: indicator 72 with maximum 100
Exceeding a positive maximum fills the arc completely and moves the needle to the end. An ellipsis appears beside the indicator, whose value remains visible in the label. A negative indicator leaves the arc empty and the needle at the start. A zero or negative maximum also leaves the scale empty without replacing the numbers in the labels.
A second example shows compact formatting for large numbers: 385.68 is compared with a maximum of 1300000000. The maximum's label displays 1.3B, meaning 1.3 billion. Abbreviating the label does not change the value used to calculate the scale.

"Gauge" widget detail: value 385.68 and maximum labeled 1.3B
Data quality widget#
The widget helps assess source data reliability: it shows the import error count and its share of the events in the selected project or process.
The "Widget settings" popup contains the following parameters.
Required controls:
- "Widget name*" field — sets the metric title on the dashboard.
- "Type" list — selects the metric type. Select "Data quality" for this example.
At least a project or process must be specified. When both are set, the process is used. If only a project is selected, all its processes are included.
Additional controls:
The following controls select the data directly:
- "Use filter variable" switch in the projects group — shows the "Project" list when off.
- "Project" list — selects the project used for calculation if no process is selected.
- "Use filter variable" switch in the processes group — shows the "Process" list when off.
- "Process" list — selects the process whose events will be checked.
Example: "Widget name*" is Качество данных and "Type" is "Data quality". Both "Use filter variable" switches are off. Обработка заявок is selected in both "Project" and "Process". The specified process determines the calculation scope. "Save" applies these settings.
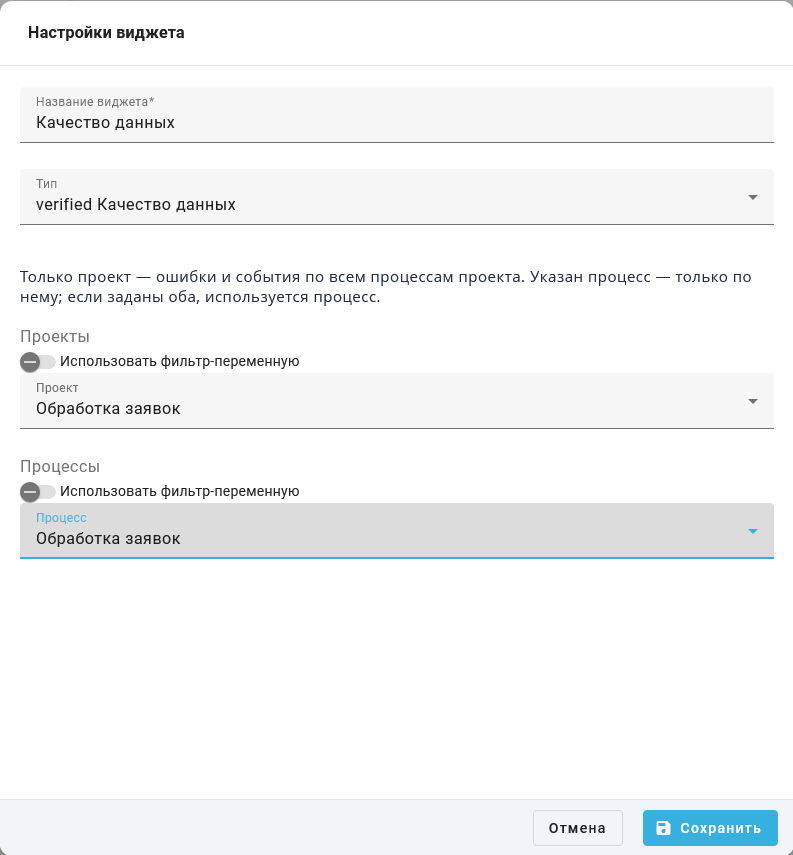
"Widget settings" popup: direct selection of project and process Обработка заявок
To use a value selected in another widget, turn on "Use filter variable" in the relevant group. The direct selection is replaced by these lists:
- "Filter variable" in the projects group — selects the widget supplying the project identifier.
- "Filter variable" in the processes group — selects the widget supplying the process identifier.
In the following screenshot, both switches are on and both "Filter variable" lists are empty. These settings are not ready for calculation: create the required variable-filter widgets on the dashboard and select them before saving. Their configuration is described in the Global Variables subsection of this article. "Cancel" closes the popup without changing the saved direct-selection settings.
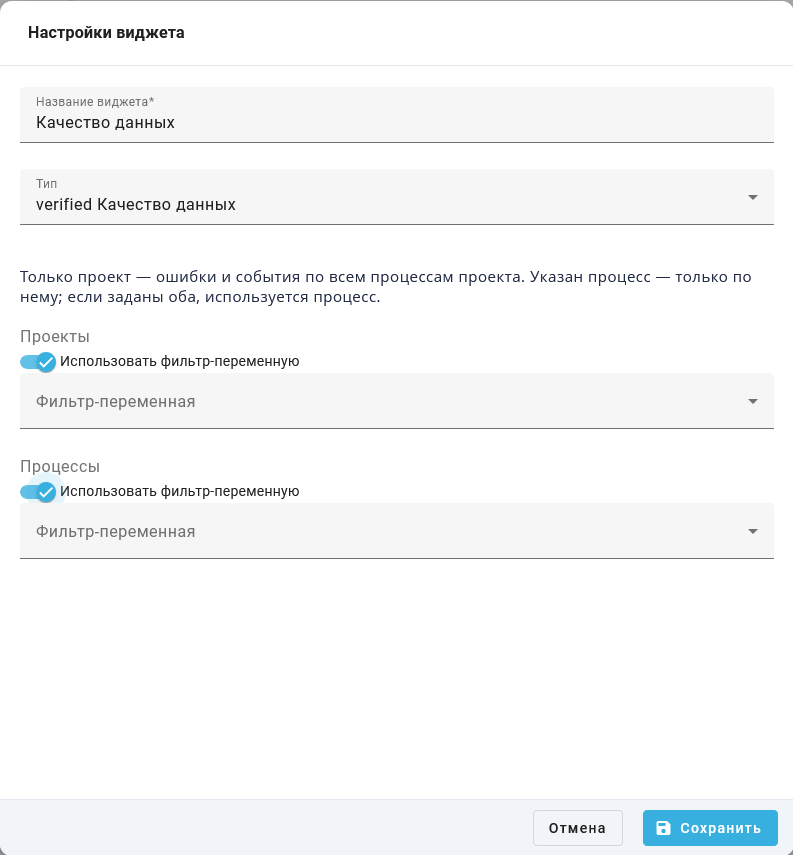
"Widget settings" popup: variable-filter selection for project and process
After cancelling the incomplete alternative, the direct selection of project and process Обработка заявок remains saved. For this data, the widget shows 14 events, 0 errors and an error share of 0 %. Values may differ for another process.
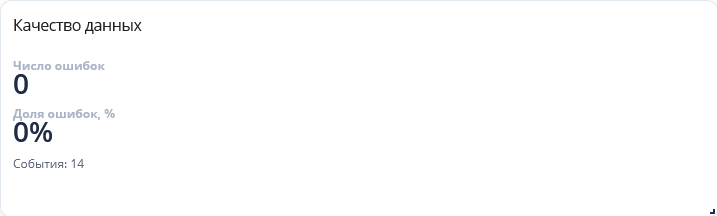
"Data quality" widget: result of the saved direct process selection
The widget is included in the Базовый дашборд and Демо-дашборд.
7. Widget Settings#
Widget settings select data, filters, and the presentation of results.
Open settings for the selected widget in the Dashboard Designer. Available fields depend on its type. Tables and charts support a widget query builder and SQL entry.
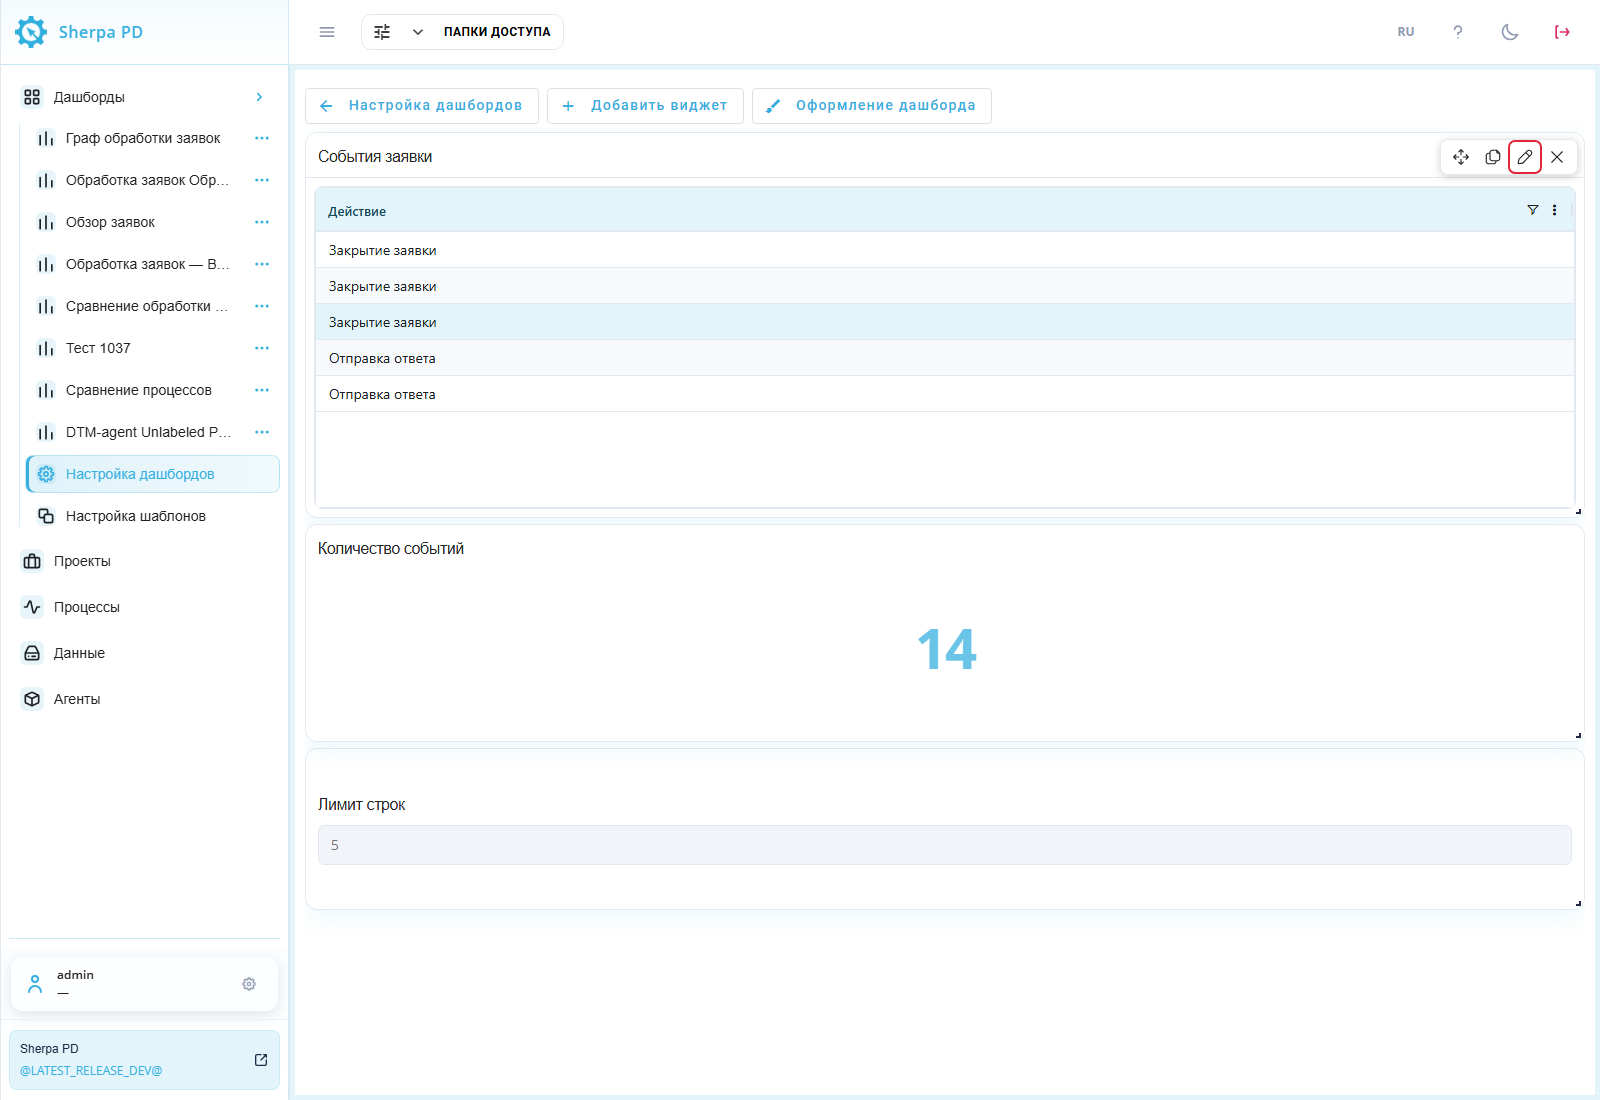
Dashboard Designer: opening table settings.
Widget query builder#
The widget query builder defines the widget type, tables, joins, filters, and result rows in successive steps. The steps are described in:
"Basic" step#
The "Basic" step has two required fields:
- "Widget name*" — explains the data shown;
- "Type" — determines how data is displayed. Options are described in "Adding a Widget".
Example: "Widget name*" is События заявки and "Type" is "Table".
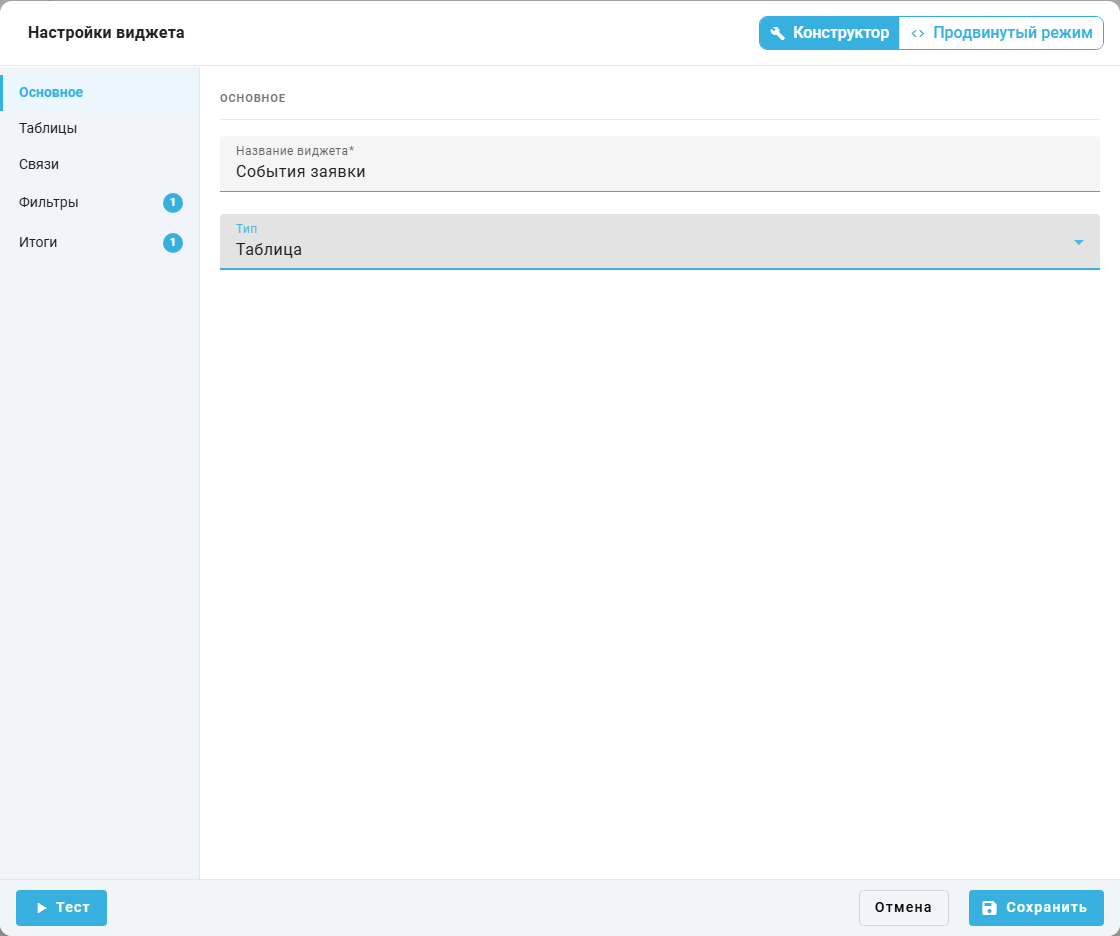
"Widget settings" popup window, "Basic" step.
"Tables" step#
Choose one or more data sources in "Tables". Added tables appear as chips. The remove button  on a chip excludes that table from the query.
Example: only mining_data, the process event log, is selected in "Tables". No other tables are added.
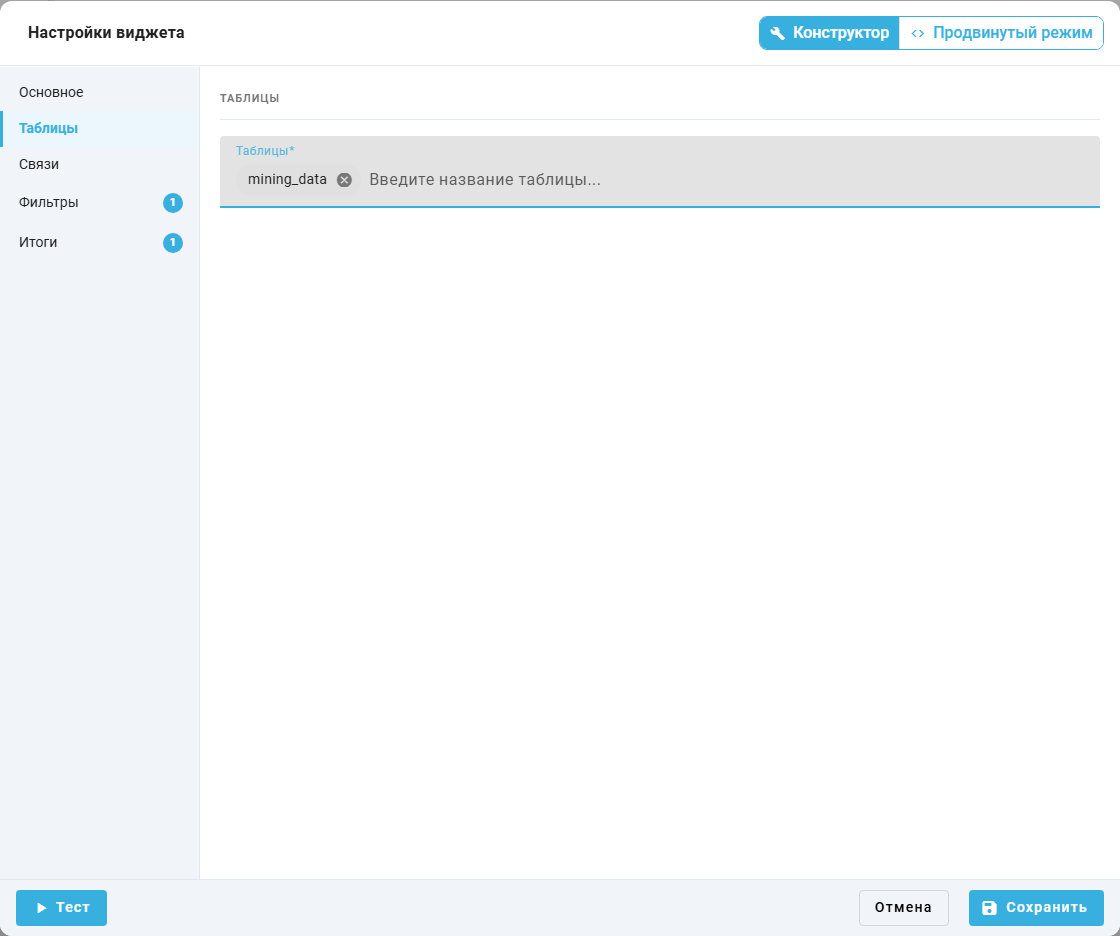
"Widget settings" popup window, "Tables" step.
"Joins" step#
Joins combine data from several tables in one query. Each condition uses "Column 1", "Operator", and "Column 2". "Add conditions (Join)" adds another condition. A single table needs no joins.
On "Joins", "Operator" offers:
=— joins records with equal values in the selected columns;!=— joins records with different values;>— joins records when the first column's value is greater than the second's;<— joins records when the first column's value is less than the second's.
Example: mining_data is the only selected table. Join fields are empty and no additional conditions are added.
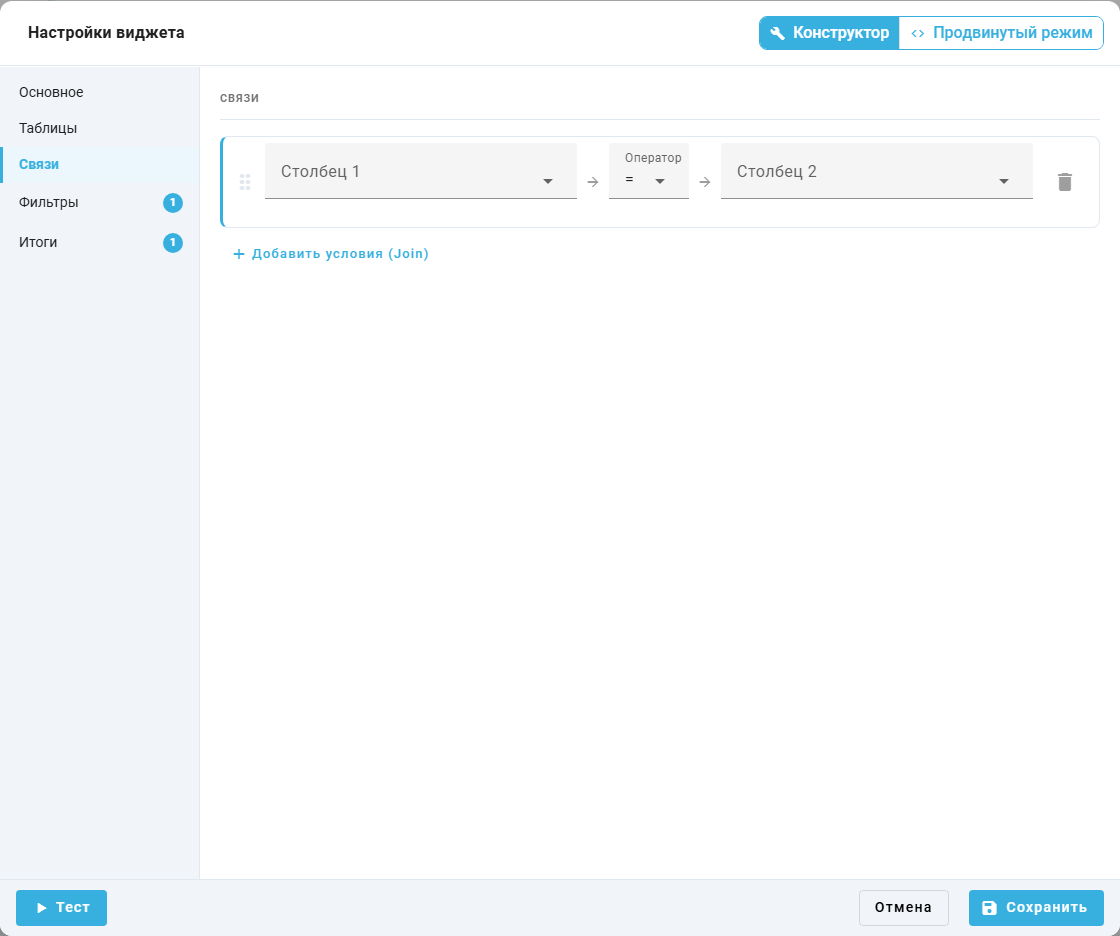
"Widget settings" popup window, "Joins" step.
"Filters" step#
Filters restrict the records included in a widget. Each condition requires:
- "Column" — column used for selection;
- "Operator" — comparison method;
- "Value" — value compared with the column.
"Add condition" extends the current group. "Add filter" creates another group. Multiple conditions use AND or OR. The link control beside a value switches it to a dashboard variable filter.
A process ID appears as ProcessID in the event details panel on Data. Use it to select one process's events.
The "Operator" list depends on the selected column's type:
=— keeps records equal to the specified value;!=— excludes records equal to the specified value;LIKE— matches text against a pattern.%stands for any number of characters and_for one character;NOT LIKE— excludes text matching the pattern;>— selects larger numbers or later dates;<— selects smaller numbers or earlier dates;>=— also includes values equal to the lower boundary;<=— also includes values equal to the upper boundary.
Text columns offer =, !=, LIKE, and NOT LIKE. Numeric and date columns offer =, !=, >, <, >=, and <=.
Conditions use these connectors:
AND— a record must satisfy all connected conditions;OR— satisfying at least one connected condition is enough.
Example: one condition selects the training process Обработка заявок. "Column" is mining_data.ProcessID, "Operator" is =, and "Value" is 41.
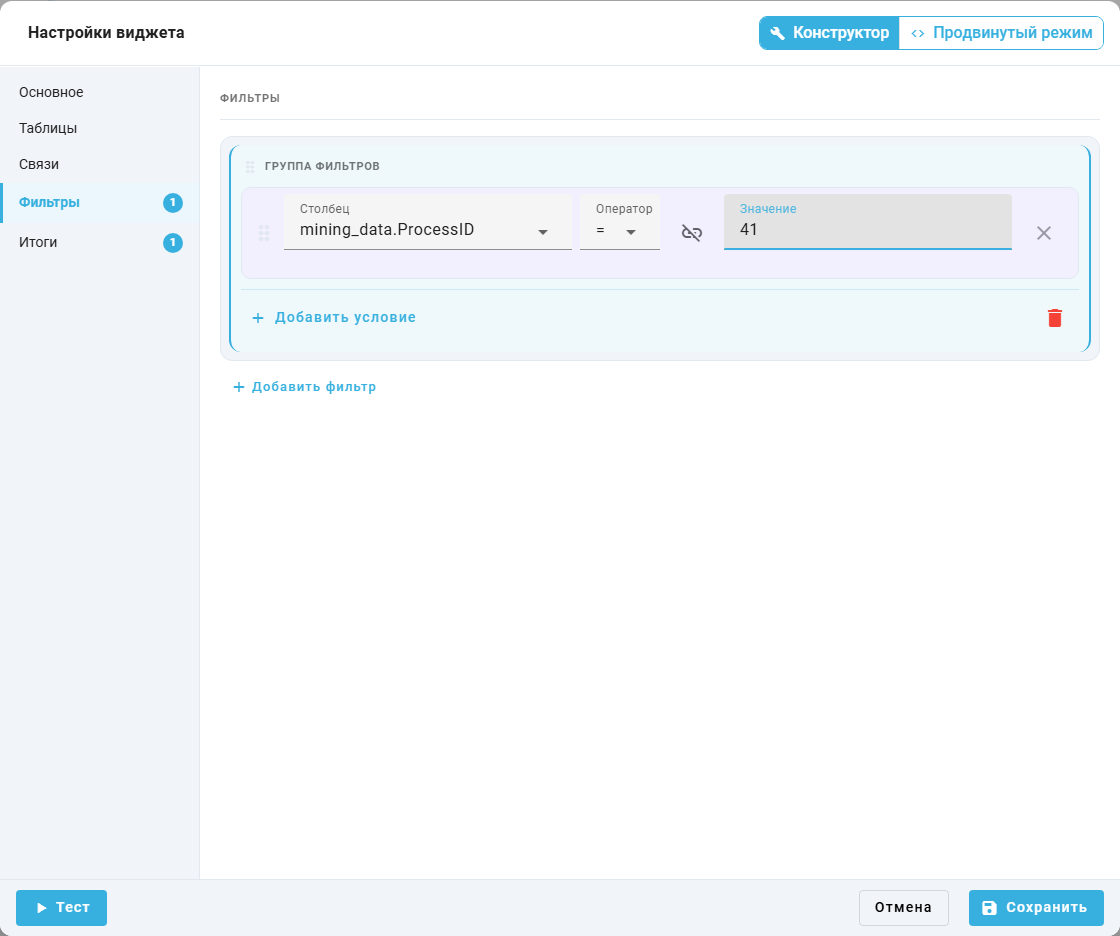
"Widget settings" popup window, "Filters" step.
"Results" step#
The "Results" step defines grouping, calculations, and result size. For tables and regular charts, "Available fields" is on the left and "Slices" and "Measures" are on the right. Search helps find a column by name.
Drag a field from the list into the required zone. A field checkbox also adds it with a suggested role. Drag it into "Measures" when it must be a measure. The button  removes a field from the query.

Widget settings, Results: field palette, a slice, and a COUNT measure
- "Slices" zone — grouping fields. "Slice name" in a card sets the result caption. Several slices form a combination of values. Without measures, identical combinations can become one row. Include the unique event identifier to display individual events.
- "Measures" zone — calculated values. Choose a function and fill in "Measure name" in each card. For example,
COUNTon "Action" counts nonempty action values. - "Sort" block — the "Column" dropdown chooses the ordering field;
ASCandDESCchoose ascending and descending order. - "Number of rows" field — limits result size. The initial value is
1000.
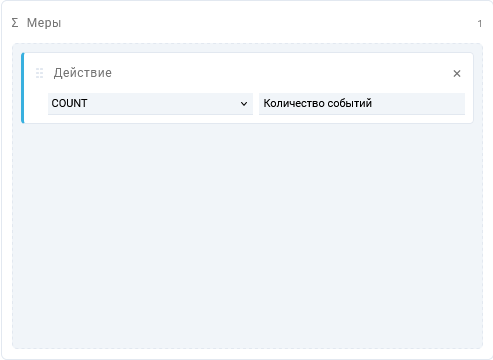
Measure card with COUNT and the measure name field
Available functions:
SUM— adds numeric values to obtain a total;AVG— calculates the average, including repeated values;AVG (DISTINCT)— averages distinct values only. Use it when repetitions should not affect the result;COUNT— counts values in the selected column;COUNT (DISTINCT)— counts distinct values, such as different computers;MIN— finds the lowest value;MAX— finds the highest value.
"Preview" updates after settings change. "Real data" identifies a response from the selected source. "Demo data" is a sample. While loading or an error is displayed, the result does not verify the new settings. "Save" applies settings. Use "Cancel" to discard changes: the cross, Esc, or clicking outside can save a valid form automatically.
Prepare five sample events manually. In a text editor, create a new document, enter the following lines and save it as uchebnye-sobytiya.csv in UTF-8. The first line contains column names. The next five lines are events from two requests.
Time,Activity,UserName,ComputerName,AppName,CaseId
2026-11-06 09:00:00,Прием заявки,qa.operator,QA-PC,Requests.exe,CASE-001
2026-11-06 09:01:00,Проверка данных,qa.operator,QA-PC,Requests.exe,CASE-001
2026-11-06 09:03:00,Закрытие заявки,qa.operator,QA-PC,Requests.exe,CASE-001
2026-11-06 10:00:00,Прием заявки,qa.reviewer,QA-PC-2,Requests.exe,CASE-002
2026-11-06 10:02:00,Закрытие заявки,qa.reviewer,QA-PC-2,Requests.exe,CASE-002
Create a separate sample project on the Projects screen, then select it on the Processes screen. Click "Upload CSV logs", select the file created on your computer and proceed to column mapping. Set these mappings to continue the import:
Time→ "Timestamp";Activity→ "Action";UserName→ "User Name";ComputerName→ "Computer Name";AppName→ "App Name";CaseId→ "Case ID".
Complete the import. The sample process must contain five events. The linked guides describe project creation and CSV import in detail. No prepared file needs to be downloaded for this example.
Example: after import, filter mining_data to the sample process using ProcessID = its identifier. Obtain that identifier from the ProcessID field in the event details on Data. On "Results", add "Action" to "Slices" and to "Measures" with COUNT and the name Количество событий. Set "Number of rows" to 5. After saving, the table shows three actions: Прием заявки — 2, Проверка данных — 1, and Закрытие заявки — 2.
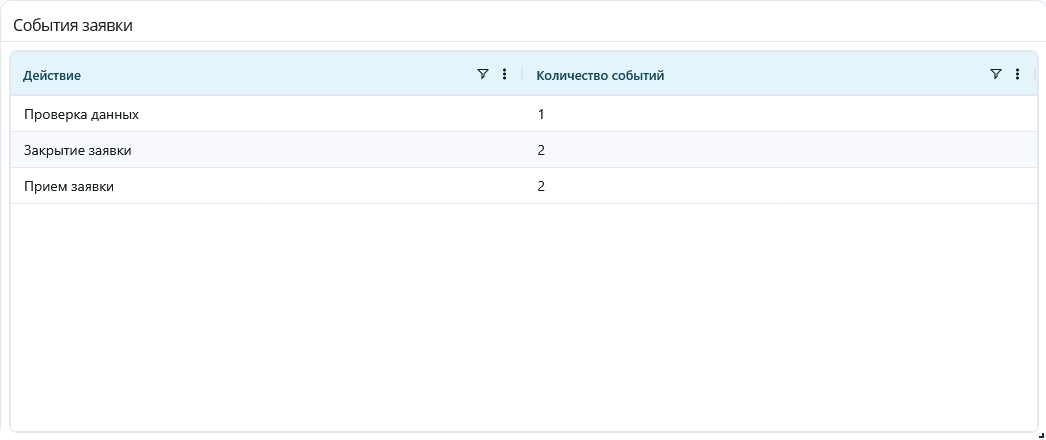
Table widget: five events grouped into three actions
For bar and line charts with multiple slices or measures, the chart layout offers two modes:
- "On one chart" / "Single chart" uses the first slice for categories and all measures for series when multiple measures are present. With one measure and multiple slices, the first slice defines categories and the second defines series;
- "Separate charts" displays data in separate panels. Slices and measures are matched in order. If the lists have different lengths, the last entry of the shorter list is reused. Widget height is divided between panels, and identical panels are combined.
Pie charts with multiple slices or measures always use separate charts. The layout switch is unavailable.
Timelines use name and StartTime, optionally FinishTime. A number widget uses the first value. Sankey diagrams use source, target, and value or count. Bubble charts use x, y, and size or z, optionally name and series. A "Comment" widget uses "Comment text" instead of a query.
Advanced Mode#
Advanced mode provides manual SQL for queries that exceed the widget query builder options. Choose "Advanced mode" and open "SQL". Query examples for the selected type and dashboard variables are shown here. "Save" applies the query. "Cancel" closes without saving. A demo preview does not confirm execution of the entered SQL. Check the saved widget result.
The query uses mining_data, the event log. The ProcessID column stores the process identifier, and ProcessID = '41' keeps only that process's events. The value 41 comes from ProcessID in an event's details panel: on Data, the project and process Обработка заявок were selected, then an event row was double-clicked.
ID contains an event identifier. count(DISTINCT ID) counts events with distinct identifiers, and AS count names the result column count. This query uses no dashboard variables.
Example: enter Количество событий in "Widget name*", choose "Number", and enter the query below on "SQL". Click "Save". The widget shows 14 for the sample process containing 14 events. Identifier 41 belongs to this example. Use your own process identifier in another installation.
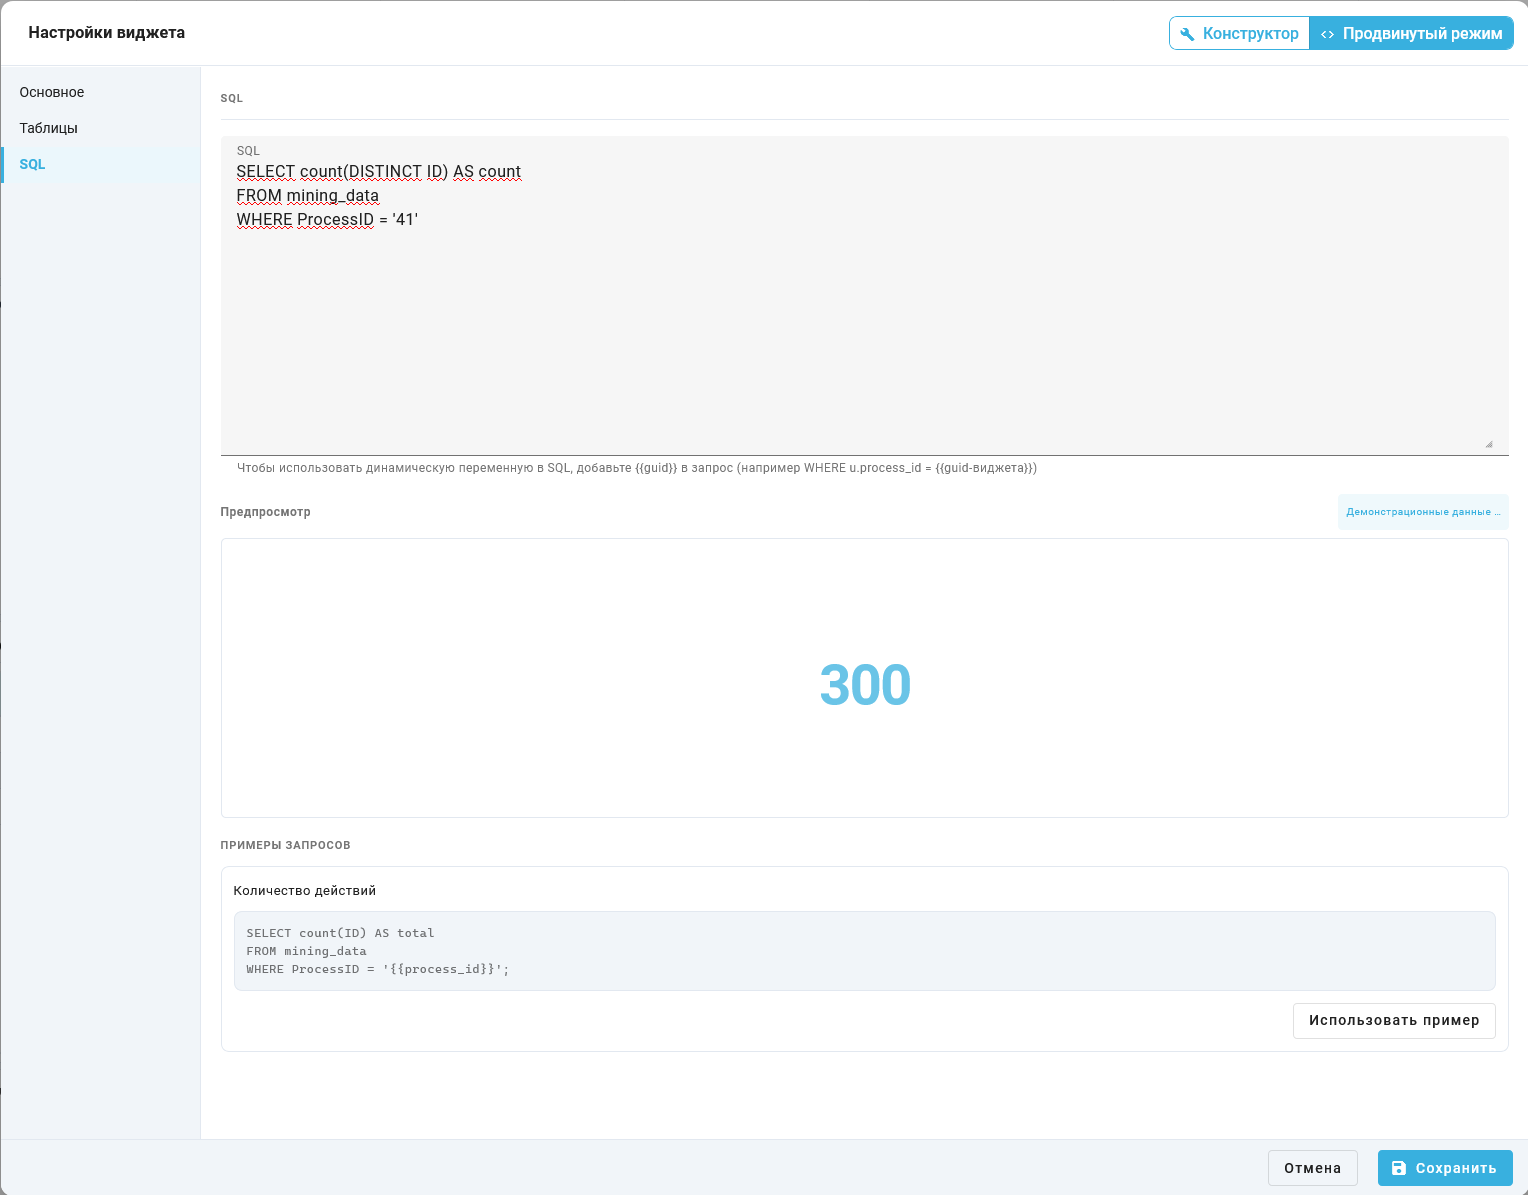
Widget settings, SQL step. The preview displays demo data
SELECT count(DISTINCT ID) AS count
FROM mining_data
WHERE ProcessID = '41'

Number widget: SQL returns 14
8. Global Variables#
Global variables are "Variable filter" widgets. They supply the value selected by the user to other widgets on the panel.
Static Value#
A static value sets the initial filter value without querying a data source.
"Variable filter" stores a value used by other widgets. "Widget name*", "Type", and "Variable type" are required. Set "Type" to "Variable filter".
The "Variable type" list offers:
Int— a whole number, such as a row limit;String— a text value, such as a computer name for event filtering;Date— a date and time for filtering events by period;Number— a number with a fractional part for numeric conditions;- "Select (multi)" — one or more records selected from a data source.
Without a data source, "Variable value" and "Default value" are available. Change the current value in dashboard view mode. Date uses a calendar. With a date source configured, the calendar highlights dates with data in blue and opens on the nearest available date. The field stays temporarily unavailable while dates load.
Example: "Widget name*" is Лимит строк, "Type" is "Variable filter", and "Variable type" is Int. "Specify data source" is unchecked. "Variable value" and "Default value" are both 5.
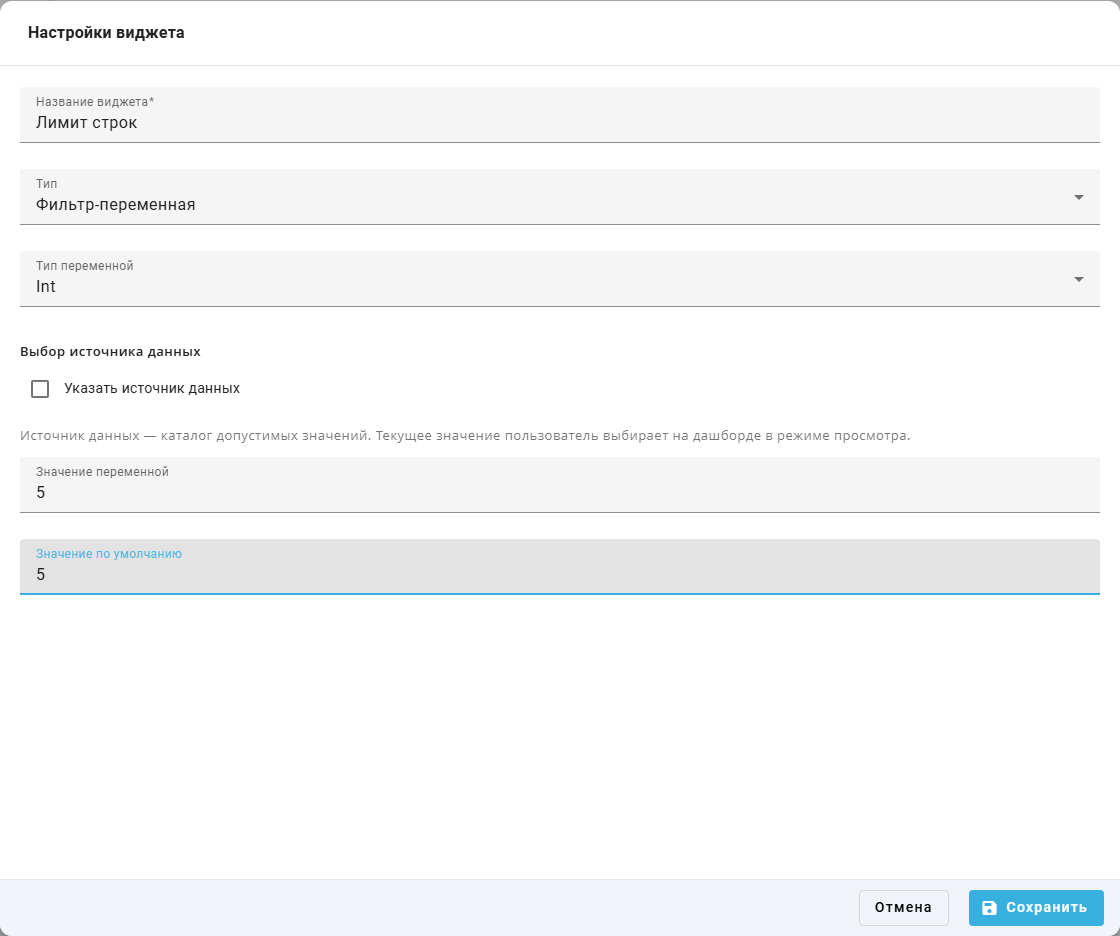
"Widget settings" popup window: variable filter with a value.
To use a variable in another widget, select its name in a filter condition. For SQL, take its reference from the variable list below the query. The current filter value replaces that reference when the query runs.
Data Source#
A data source fills a filter with values from a table, SQL query, or predefined list.
The "Data source selection" list offers:
- "Dynamic (database)" — gets values from a selected table and column. Use it for computer or application names in the event log;
- "SQL query" — gets values from a query result. Use it to filter or transform the available choices;
- "Fixed list" — defines values manually. Use it for a known set, such as request categories.
"Fixed list" is available only for "Select (multi)". Other variable types using a data source offer "Dynamic (database)" and "SQL query".
Variable filter from a table#
A data source supplies values for selection in view mode. "Select (multi)" always uses a source. For other types, enable "Specify data source". Current and default value fields are then hidden.
For "Dynamic (database)", choose "Source table" and "Source column". Also set "Widget name*", "Type", and "Variable type".
Example: "Widget name*" is Компьютер, "Type" is "Variable filter", and "Variable type" is "Select (multi)". "Data source selection" is "Dynamic (database)", "Source table" is mining_data, and "Source column" is mining_data.ComputerName.
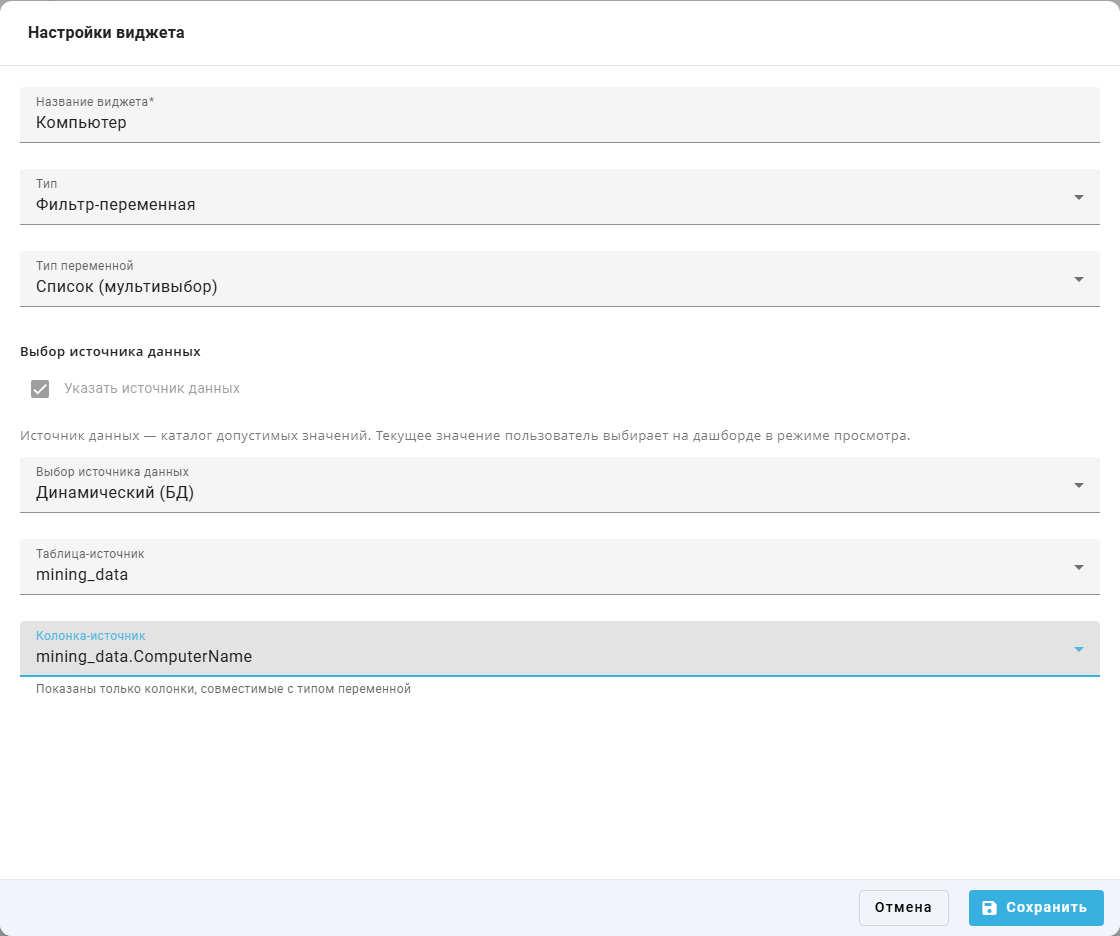
"Widget settings" popup window: values from a table.
Variable filter from SQL#
"SQL query" obtains values from a query result. Enter the selection in "Source SQL query". After saving settings, choose the current item on the dashboard.
The query selects distinct AppName values, the application names, from the mining_data event log. ProcessID = '41' keeps events for Обработка заявок. The value 41 comes from ProcessID in an event's details panel on Data. The value alias names the column from which the filter obtains its application choices. The query uses no dashboard variables.
Example: "Widget name*" is Приложение, "Type" is "Variable filter", and "Variable type" is "Select (multi)". "Data source selection" is "SQL query". "Source SQL query" contains SELECT DISTINCT AppName AS value FROM mining_data WHERE ProcessID = '41'.

"Widget settings" popup window: values from a SQL query.
Variable filter with a fixed list#
"Fixed list" defines values manually. Enter one item in each "Value" field. The plus button adds a row, and the delete control  beside an item removes it.
Example: "Widget name*" is Вид заявки, "Type" is "Variable filter", and "Variable type" is "Select (multi)". "Data source selection" is "Fixed list". The two "Value" fields contain Отчет and Заявка.

"Widget settings" popup window: fixed values.
9. Additional Data in the widget query builder#
Additional Data makes extra details from imported events available in the widget query builder.
Additional Data contains extra event data supplied during CSV import, such as the department handling a request. When uploading CSV logs on "Processes", map the required column to "Additional Data".
Available additional columns are selected in "Column" when configuring filters and result rows. Their names use mining_data.{key}, where the key is the original CSV column name. If the field is missing, check the import mapping. If it is correct, ask an administrator to check the field's availability.
Example: on "Results", searching "Column" for Отдел finds no additional column. Its import and availability must be checked before selection.
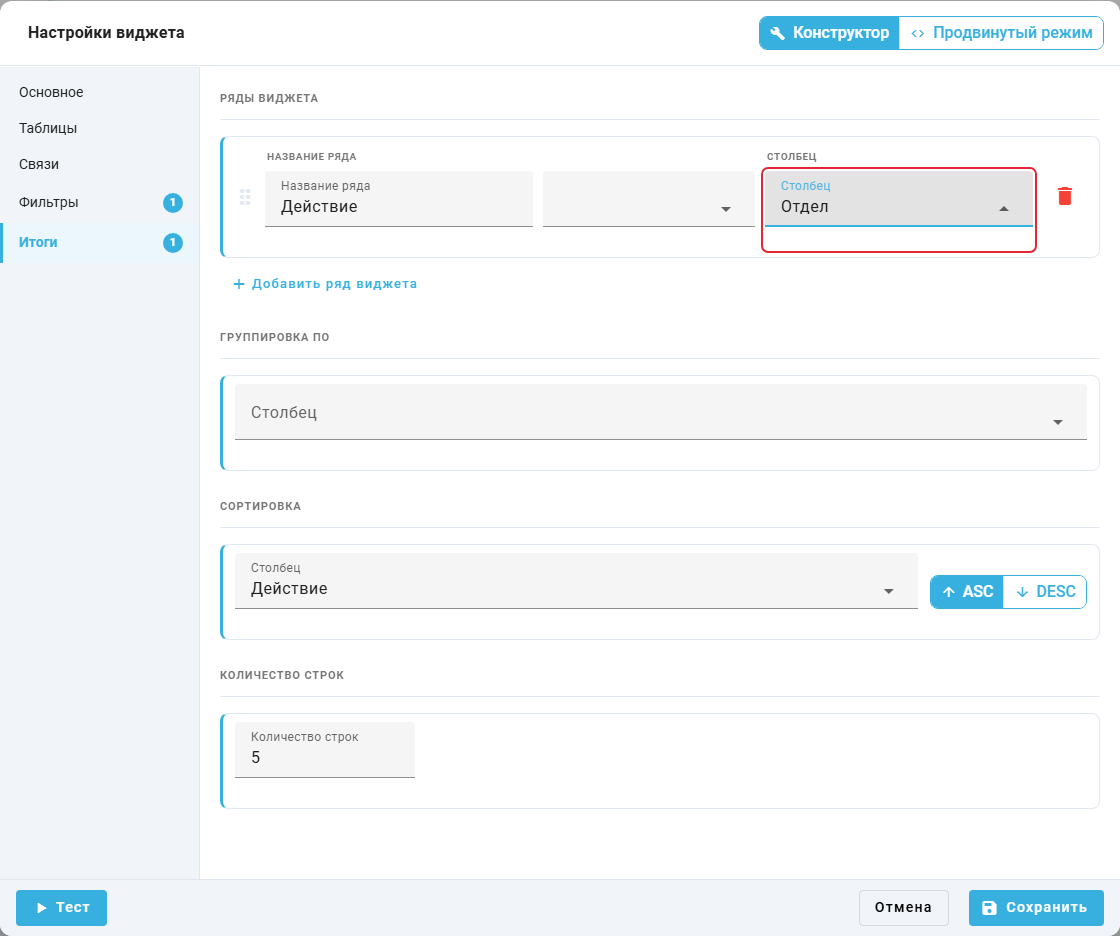
"Widget settings" popup window, "Results": searching for an additional event column.
10. Export Dashboard to PDF and PNG#
Export saves selected dashboard metrics for reports or sharing with colleagues.
"Export" button#
"Export" in view mode opens:
- "Entire dashboard as PDF" — saves a multipage PDF;
- "Entire dashboard as PNG (ZIP)" — saves widget images in an archive;
- "Select widgets…" — enables individual selection, followed by "Export selected as PDF" or "Export selected as PNG".
Variable filters are excluded from the exported files.
Example: "Export" is open to save the table and number widget. "Entire dashboard as PDF" exports them to one file.
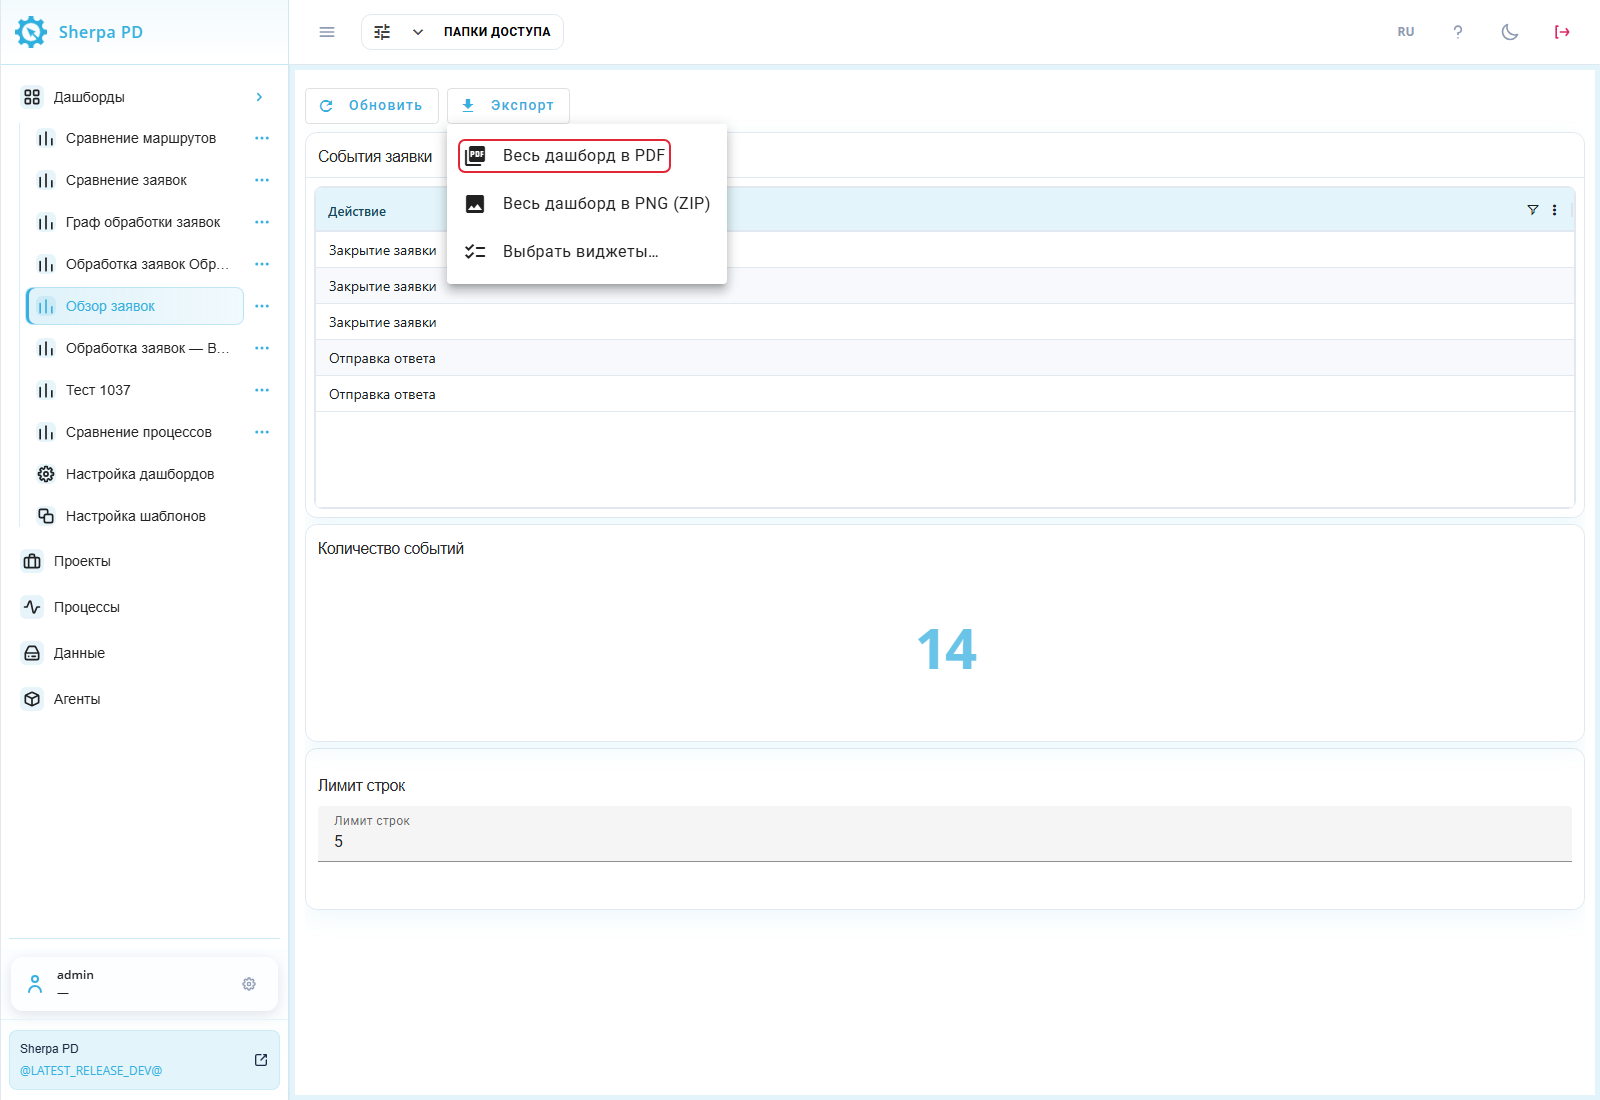
Dashboard: "Export" menu in view mode.
11. Import and Export JSON#
Use JSON to transfer dashboard configurations and create backups. On "Customize Dashboards", find the required panel and select its row checkbox. "Export JSON" saves its configuration to a file.
To load configurations, use "Import JSON" on the same screen and select a prepared JSON file. Process events are not included.
Example: Обзор заявок is selected in the registry. "Export JSON" saves its configuration.
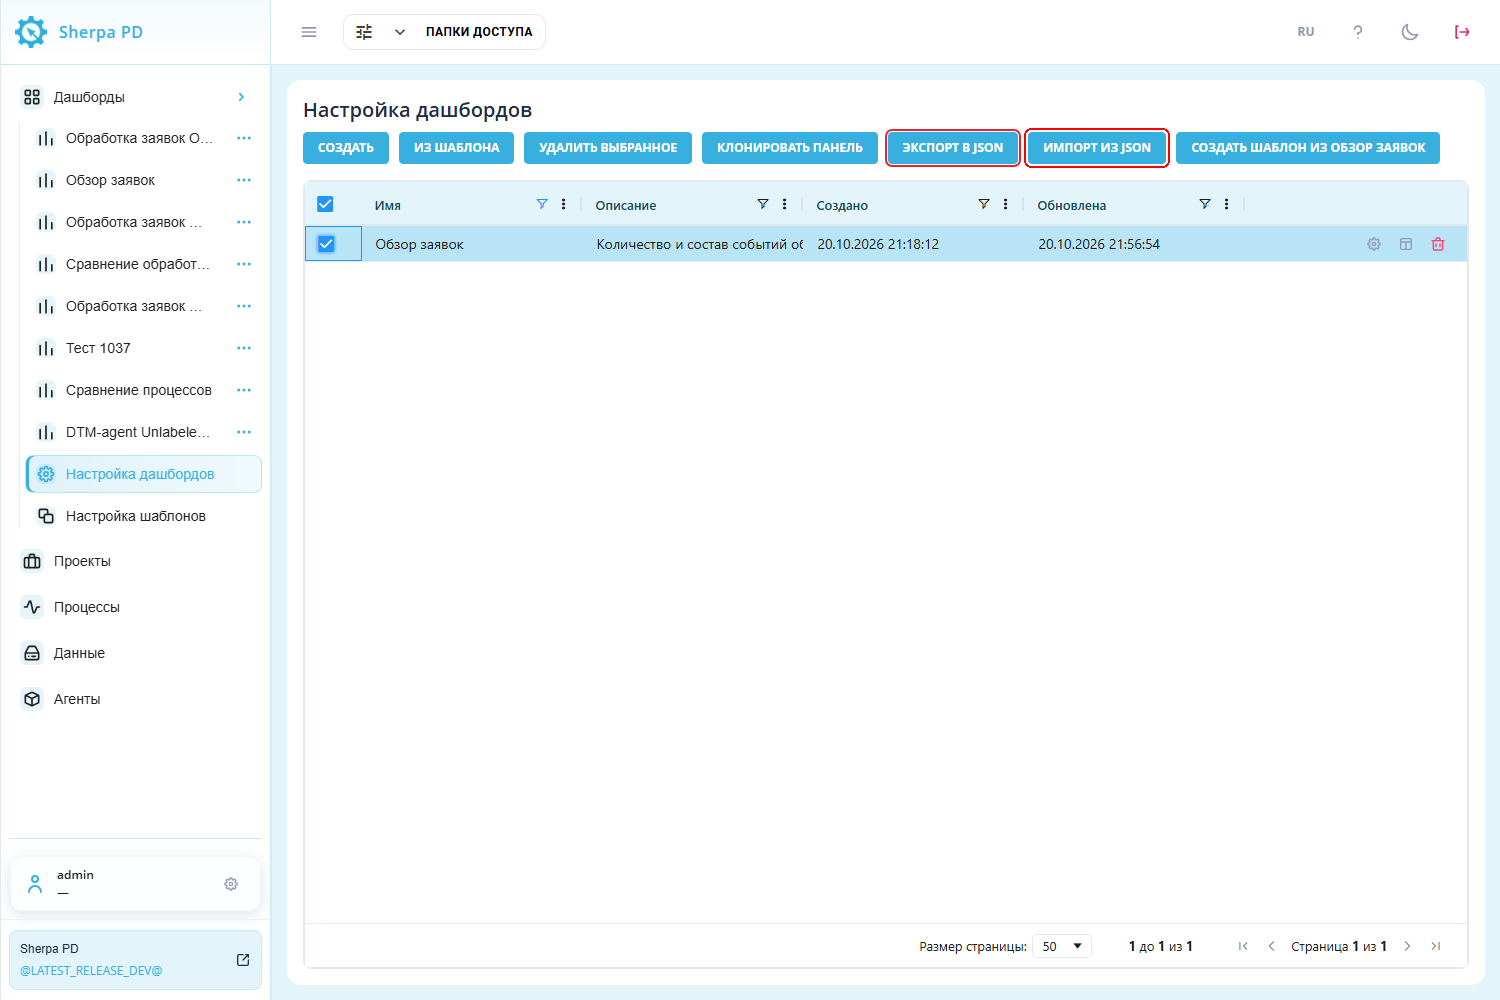
"Customize Dashboards" screen: JSON exchange buttons.
Process comparison on a dashboard#
Comparison helps identify differences between the actual route and a reference process.
Expand "Dashboards" in the left menu and select Сравнение маршрутов. Creating the panel from a template is described in "Graph", subsection "1. Build a graph".
The filter panel contains two controls:
- "Process" — selects the actual route;
- "Reference process" — selects another process in the same project.
Leaving "Reference process" empty disables comparison.
The Process graph widget must get its process from the Process variable filter and its reference from the Reference process variable filter. Set "Project ID" to the project containing both processes. The training example uses ID 24. Use your own project ID for your data.
Example: "Process" has Обработка заявок selected. Enter Эталон обработки заявок in "Search" above "Reference process", then select that record. Select exactly one record in each filter.
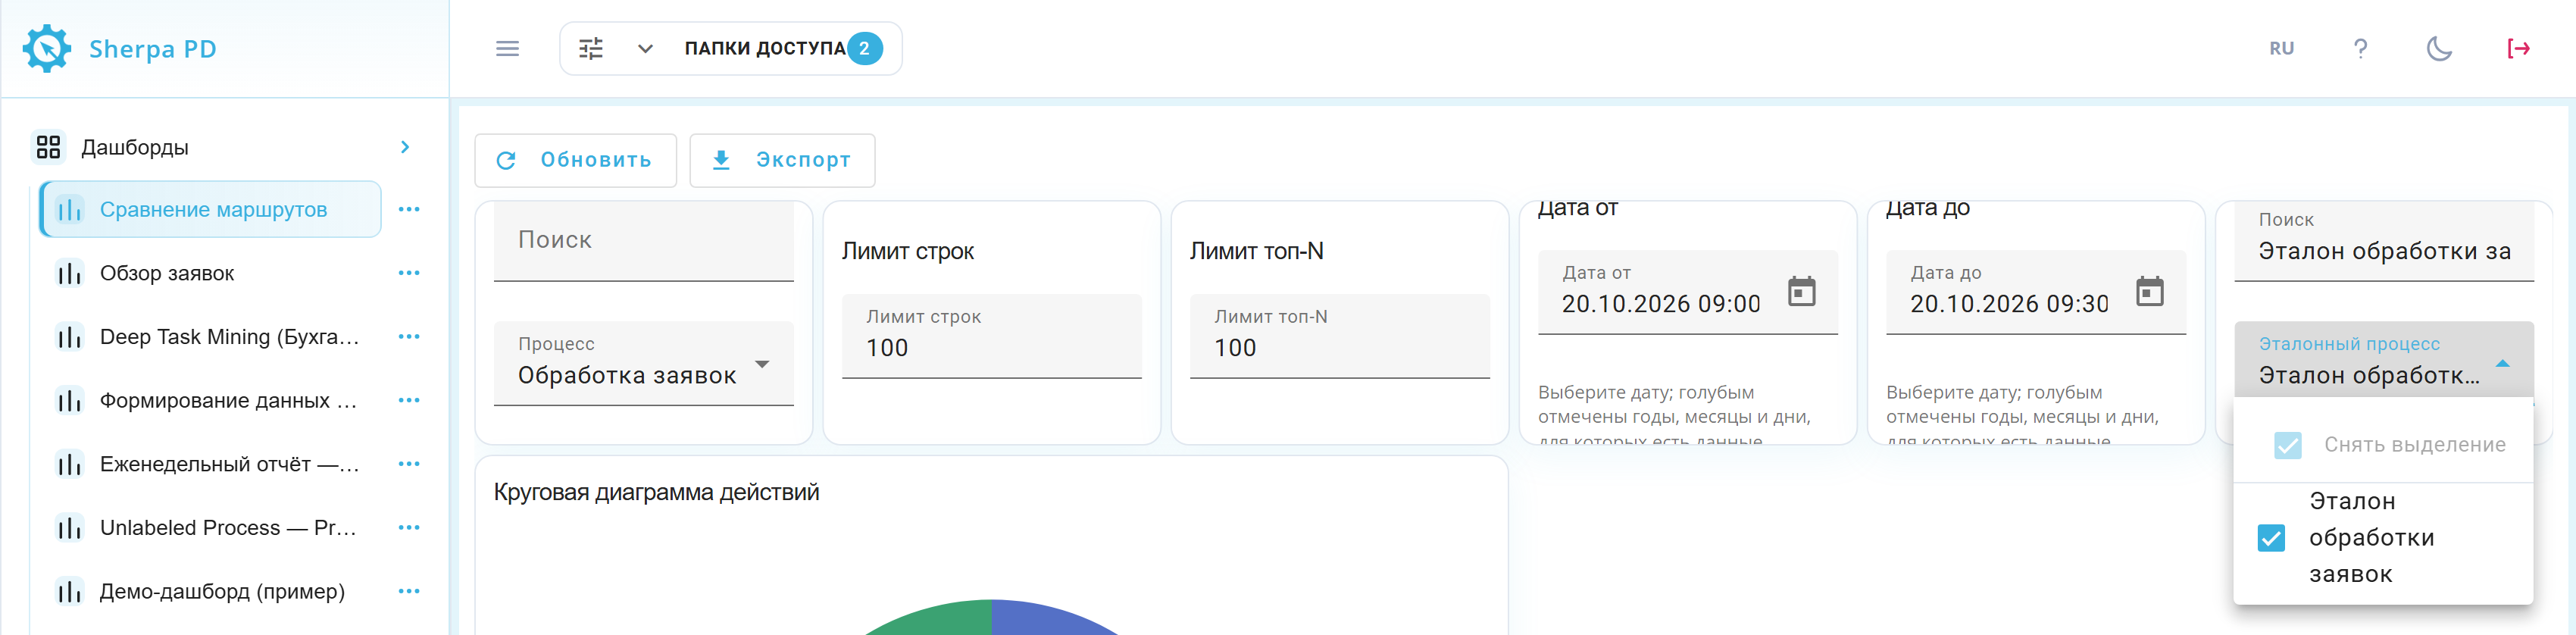
Сравнение маршрутов dashboard: actual process selected and reference list open with the selected reference. Russian interface.
The graph shows both routes. The legend marks shared transitions with a solid blue line, actual-only transitions with a dashed red line, and reference-only transitions with a solid green line.
In this example, the Уточнение данных node appears only in the actual route, while the Оформление заявки node appears only in the reference route.
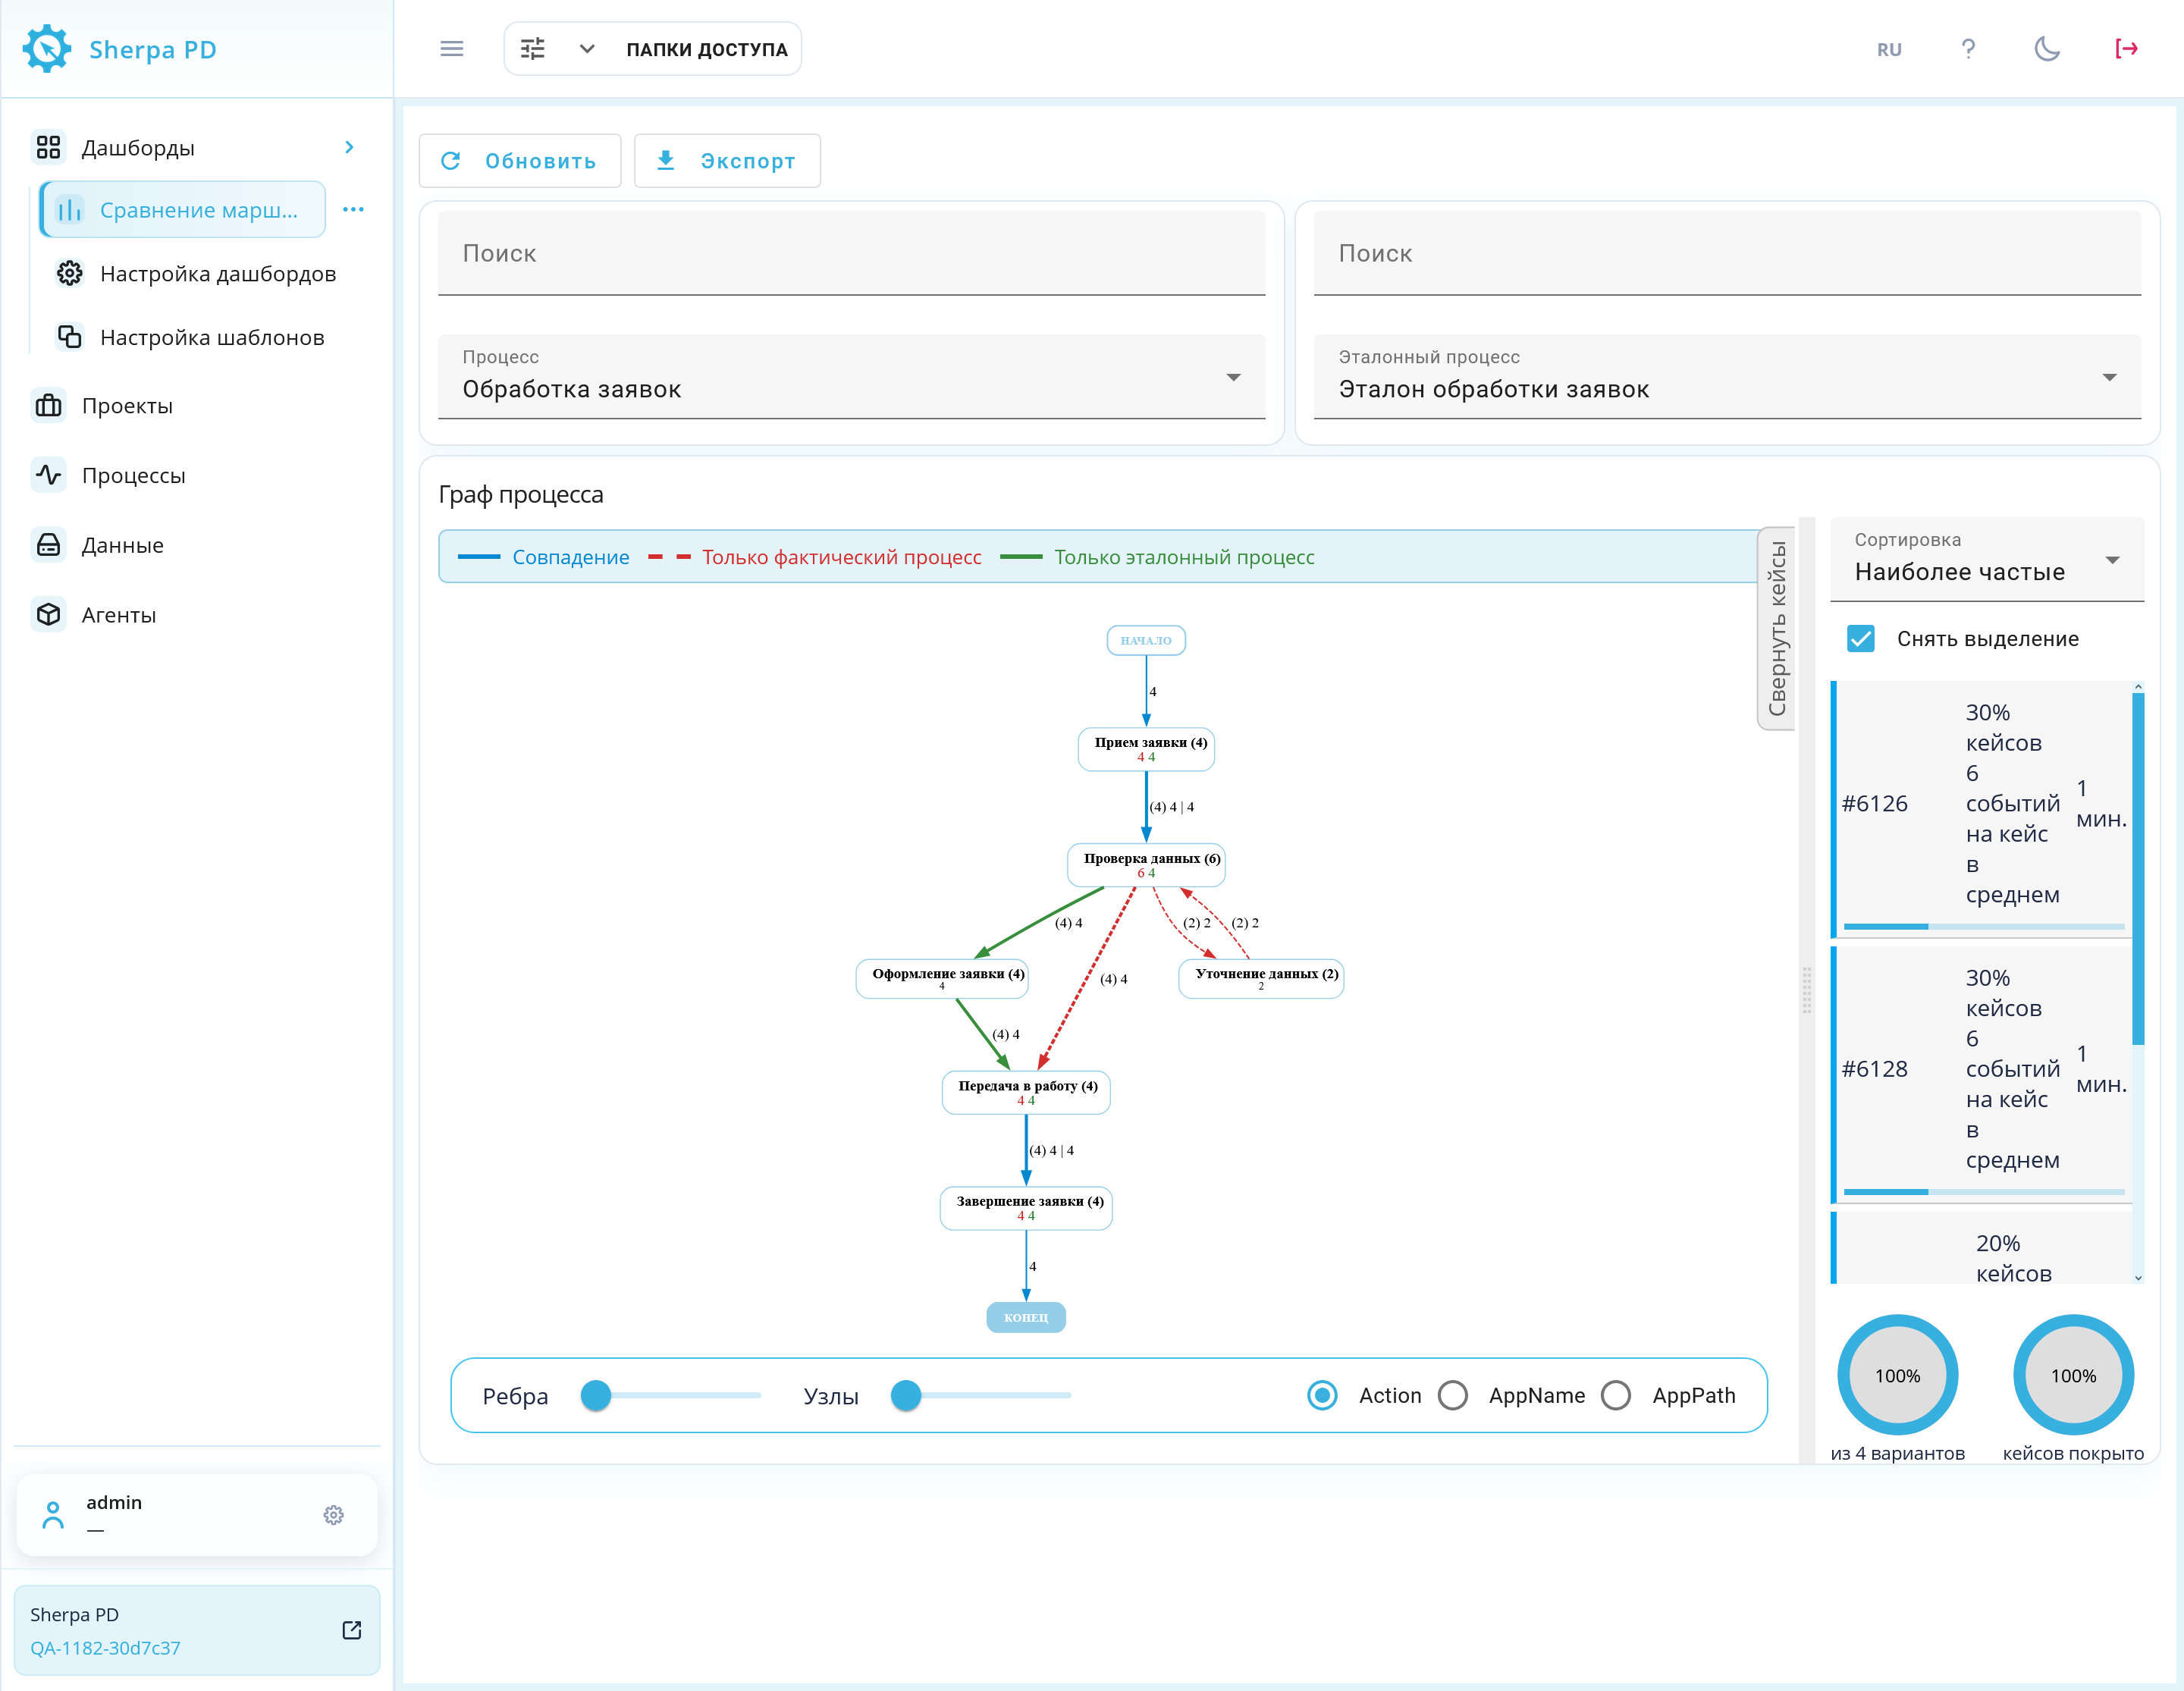
Сравнение маршрутов dashboard: selected Processes, both routes, the legend, and the case panel. Russian interface.
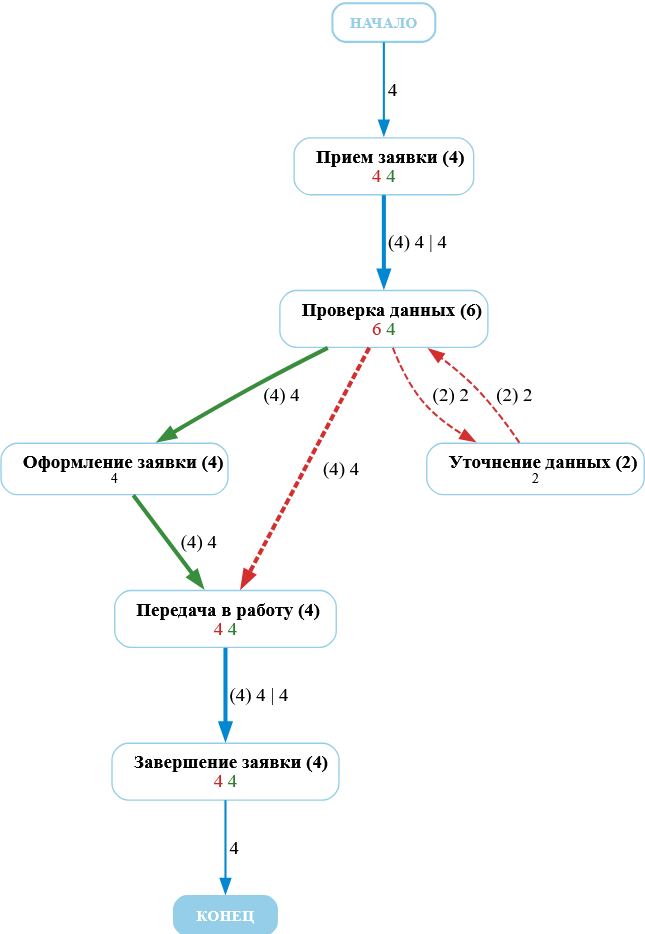
Comparison graph close-up: node names, occurrence counters, and metric values. Russian interface.
To disable comparison, clear the reference selection. See Graph for details.
Dashboard appearance#
Dashboard appearance settings adjust backgrounds, borders, and text for legible metrics.
In the Dashboard Designer, "Dashboard appearance" opens its popup window. "Save" applies changes. Closing without saving preserves the previous appearance.
The "Background mode" list offers:
- "Default" — uses the standard appearance;
- "Solid color" — fills the background with one selected color;
- "Upload picture" — uses an image for the dashboard background. It is unavailable for widget backgrounds;
- "Gradient" — creates a transition between two selected colors.
After choosing "Upload picture", its button accepts PNG, JPEG, GIF, or WebP files up to 5 MB.
Required background selections:
- "Background mode" in "Dashboard background" — panel background;
- "Background mode" in "All widget backgrounds" — widget backgrounds.
Additional elements:
- "Color" in a background block — solid color;
- "First color" — gradient start;
- "Second color" — gradient end;
- "Gradient angle, °" — gradient direction;
- "Transparency" — widget backgrounds from opaque at 0 % to fully transparent at 100 %;
- "Customize border" — enables a shared widget border;
- "Color" in "All widget borders" — border color;
- "Width, px (0–10)" — border thickness;
- "Customize text color" — enables a shared text color;
- "Color" in "Dashboard text color" — text color;
- "Padding (px)" — widget inner spacing;
- "Corner radius (px)" — rounded corners;
- "Apply to all users" — saves the account's shared appearance. Otherwise, appearance is personal. Personal settings take priority.
Example: the dashboard background is a light-blue-to-white gradient at 90°. Widgets have solid white backgrounds with 0 % transparency. A light-gray 1 px border and dark text are enabled. Padding is 12 px and corner radius 8 px. "Apply to all users" is unchecked.
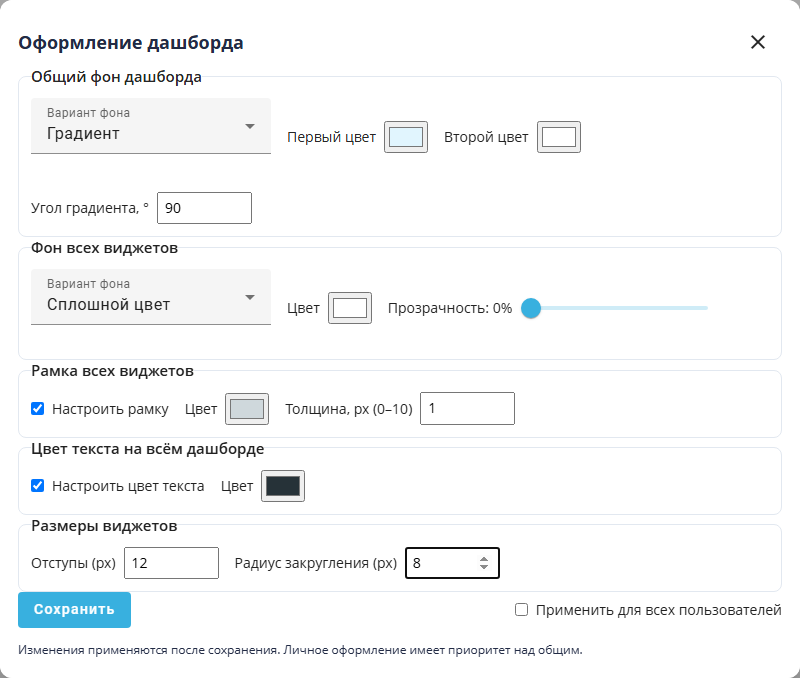
"Dashboard appearance" popup window: backgrounds, border, text, and widget dimensions.